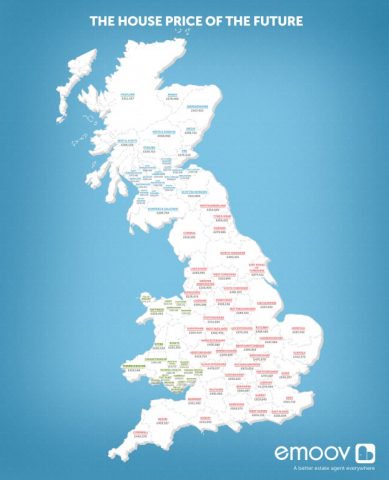
What Will the Average House Price be in 2030?
Using figures from the last 15 years, leading online estate agent eMoov.co.uk has revealed what the average house price will be in England, Scotland and Wales in 2030.
The study, into the future of the UK property market, also breaks down prices in London by each borough.
eMoov analysed house price growth between 2000 and 2015, finding that the average property value has soared by 84% over the last 15 years. Using the same increase, the firm has projected how much the average home in London, England, Scotland and Wales will cost over the next 15 years.
London
Unsurprisingly, London took the top spot in terms of highest property value by 2030, with an average home in the capital costing over £1m in 15 years’ time.
What Will the Average House Price be in 2030?
eMoov has also broken London down by borough to show which places will be the cheapest and most expensive by 2030.
For those looking to get onto London’s property ladder in the next 15 years, the best borough to look at is Barking and Dagenham, which is currently the most affordable place to buy a property in the capital. However, the definition of affordable is somewhat different in 2030, with the average house price in the borough expected to be over £450,000, compared to £246,000 today.
At just under £1.9m, Kensington and Chelsea has long been the most expensive borough in London to buy a home. But by 2030, even the wealthiest of buyers may struggle to purchase a property, with a typical price of £3.4m.
England
By 2030, the average house price in England could shoot up to £457,433 – close to the current asking price in London. Based on the current market, just three places in England will offer an average house price below £280,000 in 15 years’ time – Merseyside at £275,074, East Riding of Yorkshire at £277,411 and Durham at £279,985.
Excluding London, 12 counties in England will also be home to an average house price over £500,000. Property in Dorset, East and West Sussex, Kent, Essex, Berkshire, Surrey, Oxfordshire, Hertfordshire, Buckinghamshire, Cambridgeshire and Rutland will command over half a million pounds on average.
Wales
The current trend of Londoners moving to the surrounding areas of the capital may soon become a national trend of English homeowners moving to Wales.
In 2030, the average house price in Wales is expected to hit £307,712; although pricey, still £150,000 cheaper than England. Just one part of the country, Monmouthshire (£442,141) will have an average house price over £400,000.
Scotland
Similarly, English homeowners may also look to move to Scotland. Of the three countries studied, Scotland will have the cheapest average house price in 2030, at £297,222. Edinburgh will continue to drive the market, with the highest price of £432,468. Aberdeenshire is the only other Scottish location to break through the £400,000 mark.
At £200,600, North Lanarkshire will offer the cheapest house price to Scottish buyers in 15 years’ time.
The CEO of eMoov, Russell Quirk, says: “The past 15 years have seen extreme growth in the price commanded for UK property, as well as a crash as a direct result of this inflated growth. Although this research is only a projection of what may happen by 2030, it is safe to assume that with prices continuing to spiral beyond affordability, history could well repeat itself.
“Although rising prices are always good news for current homeowners, it’s extremely worrying to look at the difficulty many have in getting on the ladder at the moment, let alone with a price jump of 84% by 2030.
“This map highlights just how dangerous this current artificial inflation of the market could be in the long run, it’s not just London that will become beyond the reach of the average UK homebuyer, the issue will spread the length and breadth of England, Scotland and Wales.”