Posts with tag: house price growth

Two Regions Surpass London’s House Price Growth

The East of England and the South East have surpassed London’s house price growth, according to new data from the Land Registry.

The East, ranging from Hertfordshire to Norfolk, experienced an average annual rise of 8.4%, almost 2% higher than the property price growth seen in the capital.

Two Regions Surpass London's House Price Growth

Two Regions Surpass London’s House Price Growth

In second place is the South East, encompassing popular commuter hotspots such as Buckinghamshire, Surrey and Hampshire. This region traditionally shadows London’s price rises.

However, the capital’s house prices are still significantly higher. The average value in London is close to £500,000, almost double that in the East, at £210,042, and South East, at £254,658.

Sophie Chick, part of the Savills residential research team, says: “Both regions are well positioned to benefit from buyers looking for more for their money outside the capital, but still within an easy commuting distance to central London.”1

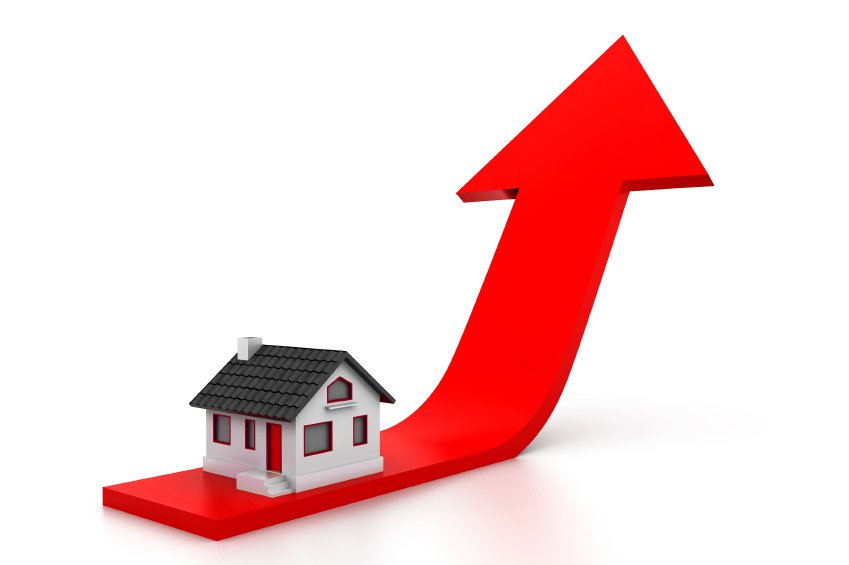
Research by Savills indicates that prices in the top two regions could rise by a further 25% over the next four years, compared with 10% in the capital.

Director of Your Move and Reeds Rains estate agents, Adrian Gill, comments: “The market in London appears to have got the ball rolling again, as buyers get used to the heavier taxation, and prices in the capital and surrounding regions continue to travel at a much faster pace than up in the North West, North East and Yorkshire.”

Indeed, the North West, Yorkshire and the Humber, and the East Midlands all witnessed monthly price declines. Meanwhile, prices in the North East rose by a slight 0.5% and Wales has only just recovered from negative figures last month, to a 0.2% increase this month.

The South West, running from Gloucestershire to the Isles of Scilly, and the West Midlands, from Wolverhampton to Coventry, are two regions that are continuing to see steady growth.

Gill continues: “Sales activity may look slightly subdued on an annual basis, but property sales have actually been picking up speed solidly since the start of the year, and rose 4.4% between May and June.

“Most importantly, the gates are firmly propped open at the bottom of the market and our own research shows this has been the strongest summer for first time buyer sales since 2007.

“With an interest rate rise largely speculated to happen next year, the race will be on for many looking to move up the property ladder before borrowing becomes more expensive.”1 

1 http://www.homesandproperty.co.uk/property-news/news/uk-house-prices-london-now-third-fastest-growing-region

Sales Drop by 13% in a Year, Reports Land Registry

Published On: September 29, 2015 at 12:56 pm

Author:

Categories: Landlord News

Tags: ,,,

The amount of homes sold in England and Wales has dropped by 13% over the last year, reports the Land Registry.

The Land Registry’s market trend data report, containing its latest figures, reveals that there were just 70,404 completed house sales in June, compared with 80,823 in June last year.

The data also shows that the average house price has risen annually to August, by 4.2%, making the average property price in England and Wales £184,682. Prices grew by 0.5% between July and August.

Sales Drop by 13% in a Year, Reports Land Registry

Sales Drop by 13% in a Year, Reports Land Registry

Group Managing Director for Mortgages at Aldermore Bank, Charles Haresnape, comments on the findings: “While the annual price increase of 4.2% in the average house price will bring positive news for homeowners, the 13% decrease in completed house sales in England and Wales compared to June 2014 is worrying news.

“The fall may in some part reflect the impact of tighter lending criteria, but price rises are likely to prove a constraint on the number of first time buyers.”1

The highest price rise over the past year was experienced in the East of England, with homes now costing an average of 8.4% more than they did in August 2014. London witnessed the greatest monthly growth, of 1.7%.

The highest annual price increase in the capital was seen in Newham, East London, at 15.5%.

Chairman of national agents Jackson-Stops & Staff, Nicholas Leeming, explains: “Buyers are seeking areas offering the best value and proximity to work, which reflects not only the performance in the East of England, where the Cambridge effect and regional investment are bearing fruit, but also in boroughs such as Newham and Barking and Dagenham.

“On the wider front, we are seeing a continuing trend of higher property values for reported sales, but of more concern is the reducing numbers of properties coming to the market.

“However, this supply constraint in the middle markets is not being matched in the higher value sector, where many properties are struggling to find buyers at their current guide prices, mainly because of the effect that the Stamp Duty increase last year has had.”1 

Property prices in the North West rose by the lowest amount, 0.2%, while the region also experienced the greatest monthly decline, of 1.4%.

Prices also dropped in Yorkshire and the Humber at 0.3% and the East Midlands at 0.2%.

The South East saw annual house price growth of 7.6% and London’s average price is now 6.6% higher than last year.

The data also reveals that semi-detached house prices increased more than any other property type. Annual growth of 4.7% for these properties compares to a 4.5% rise for detached homes.

The price of flats and maisonettes is now 4% higher than in August 2014 and terraced houses cost 3.7% more.

Chief Executive of housing charity Shelter, Campbell Robb, says continuing price growth is “pushing the dream of a stable home out of reach for millions”.

He continues: “Piecemeal Government schemes like Help to Buy or Starter Homes just aren’t helping the ordinary families who are completely priced out of a home of their own and left to face the huge costs and instability of private renting.

“The autumn spending review is the Government’s last chance to show they’re serious about giving millions of people a fair shot at a stable future by investing in the genuinely affordable homes they desperately need.”1

1 http://www.propertyindustryeye.com/land-registry-says-sales-fall-by-13-in-year/


First-time buyer prices rise again

Published On: September 29, 2015 at 11:24 am

Author:

Categories: Finance News

Tags: ,,

New research conducted by estate agents haart suggests that UK property prices rose again during the last month, to continue the upward spiral consistently seen over the rest of the year.

Growth

According to the report, British property prices were up 7.3% annually and by 0.9% on the previous month. This took the average home to a price of £219,315.

Moreover, the number of new buyers registering has risen by 1.7% in the last month and by 10% annually. However, supply of new homes continues to be the Achilles heel of the market, with numbers down by 3.6% monthly and by 14.7% on the same period last year. As a result, twelve buyers are competing for every property that comes onto the market, the highest ratio for 17 months.[1]

First-time buyer house prices are accelerating at a quicker pace than the rest of the market, up 9.9% annually and by 0.9% over the month. The average price of a starter home is now £169,259.[1]

The number of first-time buyers is up by 8.5% on last August and there has been a monthly rise of 1.2%. Of all mortgages written in August, 41.6% were written for first-time buyers. This was a drop from 45.9% at the same time last year, but a rise of 0.3% from July. Significantly, the average first-time buyer deposit rose by 7% n the last month to reach £34,472.[1]

Concern

Paul Smith, CEO of haart, said that, ‘it is concerning to see the growth in the price of starter homes outstripping the rest of the market as it means it is becoming increasingly difficult for first-time buyers to get on to the property ladder.’ Smith feels that the, ‘10% annual increase in first-time buyer house prices comes as a result of a shortage of homes, due to lack of building but also the absence of fluidity in the upper echelons of the market, as people who might otherwise be moving to their second or third hold on to their current property for its value to increase further.’[1]

First-time buyer prices rise again

First-time buyer prices rise again

‘However if the seller is upsizing, any increase in the value of their current home will be negated by the increase in the price they pay for their next, more expensive property. With good availability of fixed-term mortgages and a number of known unknowns in the near future such as interest rate rises our advice for on-the-fence sellers is to do so now while the conditions are favourable,’ Smith continued.[1]

Concluding, Mr Smith said that haart’s research, ‘shows first-time buyers must now find a 20% deposit of around £34, 000-30% greater than the average salary. These are likely funded by the Bank of mum and dad so their offspring can take advantage of current interest rates and mortgage availability. We need all levels of the market to take advantage of current positive market conditions to ensure there is movement and appropriate homes are available to the various demographics looking to buy or move up the property ladder.’[1]

[1]http://www.propertyreporter.co.uk/property/ftb-house-prices-outpace-rest-of-market.html


House Price Gap Between London and Other Cities Widest for 20 Years

Published On: September 25, 2015 at 2:52 pm

Author:

Categories: Property News

Tags: ,,,

The average house price paid for a home in London has reached a record high of 12 times earnings, and the gap between prices in the capital and other big cities in the UK is at its widest for 20 years, reveals an industry report.

Although recent research indicates a slowdown in the prime London property market, the monthly study by Hometrack shows that the difference in average prices between the capital and other large cities has continued to widen. The report states that the growing gap “highlights a seemingly overvalued London market”1.

Hometrack compiled its report using Land Registry data and statistics from mortgage valuations. It reveals that in Liverpool and Glasgow, homes are around 75% cheaper than in London.

House Price Gap Between London and Other Cities Widest for 20 Years

House Price Gap Between London and Other Cities Widest for 20 Years

The average price paid in the capital is now £437,700, but is just £107,300 in Glasgow and £109,600 in Liverpool. Even in Bristol, where activity has been high, prices are 47% below those in the capital, despite prices rising 16% above their 2007 peak, to an average of £231,300.

The report also found that half of homebuyers in the first half of the year did not have a property to sell, with the change in purchasers putting upward pressure on prices.

Hometrack’s findings mirror those of other reports that there is a shortage of properties coming onto the market. The Royal Institution of Chartered Surveyors (RICS), for example, claims that listings have fallen for several months.

Within the UK’s 20 largest cities, Hometrack found that prices have risen by an average of 8.3% since September last year, but vary hugely. In Aberdeen, prices fell by 2% over the past year, to an average of £193,000, as the cheap cost of oil caused job cuts and reduced demand for housing.

However, in Cambridge, prices are up 11.2% on last year, with residents and investors fuelling market activity. The average price in the city is now 43.6% above its pre-recession peak, at £388,600.

In London, prices are now a higher multiple of wages than ever before, while in other big cities, the ratio is currently at its long-term average.

Hometrack suggests that price rises could spread, as investors and developers seek more affordable markets.

Director of Research at Hometrack, Richard Donnell, explains the findings: “A changing mix of buyers is compounding the scarcity of housing for sale with rising numbers of first time buyers and investors buying property while having nothing to sell. Only a recovery in the number of moves among existing homeowners or an increase in new supply will ease the current housing scarcity, which seems unlikely in the near term.

“London’s price earnings ratio is at an all-time high, while there remains value in most other regional cities. The pricing differential [with] London could well assist city regions to attract new investment, as the cost of housing starts to influence decision-making for both households and businesses.”1

The National Association of Estate Agents (NAEA) recently reported a lack of homes being put up for sale.

It states that the number of properties listed by each of its member agents dropped by a third in August, to an 11-year low. Agents had an average of 38 homes on their books last month, down from 55 in July.

Additionally, the amount of prospective buyers fell from 462 to 408 per branch.

Mark Hayward, Managing Director of the NAEA, says: “There are now 11 house hunters fighting after every available house, which isn’t sustainable.

“First time buyers are finding themselves being squeezed out of the competition, which of course means it’s taking young buyers longer to get their foot on the first step of the ladder, which will in turn increase pressure on the rental market.”1 

1 http://www.theguardian.com/business/2015/sep/25/house-price-gap-widest-for-20-years-between-london-and-other-cities


The Countries with the Highest House Price Growth

Published On: September 22, 2015 at 5:23 pm

Author:

Categories: Landlord News

Tags: ,,,

House prices around the world are continuing to soar, with property booms in Europe, North America and some parts of Asia, according to a new study by Global Property Guide.

The research firm revealed that house prices increased in 28 countries in the second quarter of the year and fell in just 11.

Of the five countries to record the strongest property price growth, three were in Europe and the other two were in Asia.

Despite thinking the UK has a difficult property market, Hong Kong saw the highest house price rises in the global market.

Residential property prices in Hong Kong increased by 16.4% in the year to the end of June, a huge reversal on its 0.66% drop in 2014.

Countries with the strongest house price growth

Position

Country

House price growth

1 Hong Kong 16.43%
2 Ireland 10.81%
3 Estonia 8.99%
4 Philippines 6.61%
5 Iceland 6.19%
6 Japan 6.13%
7 USA 5.39%
8 Israel 5.22%
9 New Zealand 5.19%
10 Romania 4.83%

Of the 20 European countries for which data is available, 13 experienced house price rises in the past 12 months.

Ireland came second overall for global property price growth after witnessing a house price boom, following a difficult year in 2013.

The Countries with the Highest House Price Growth

The Countries with the Highest House Price Growth

Prices were up by 10.8% in the year to the end of June, causing the OECD to warn that soaring house prices could pose one of the biggest risks to the country’s financial stability.

The think tank stated that an uncontrolled property boom would “increase vulnerabilities, especially if it were associated with further indebtedness”1.

Estonia saw the second biggest price rises in Europe and came third in the global market. This was despite prices levelling compared to last year. In its capital, Tallinn, the average property price increased by 9% in the year to June, much less than the 16.1% rise it experienced over the same period last year.

In Romania, prices grew by 4.8% during the year. Norway, the UK and Germany followed with increases of around 4%.

However, some parts of Europe remained slow, according to the study.

Russia has the second weakest housing market and witnessed the biggest annual drop in prices in Europe.

House prices in Russia fell by 11.1% in the year to June, the biggest annual decline since the fourth quarter (Q4) of 2011.

Ukraine’s property market is struggling, amongst an economic and political crisis.

The average house price in Kiev decreased by 10.6% over the year, and fell by 1.6% between April and June on a quarterly basis. These sharp drops were caused by the high interest rates imposed to tackle hyperinflation.

Other weak property markets in Europe include Greece, Spain, Cyprus and Croatia.

The greatest annual decreases were recorded in the United Arab Emirates (UAE), Russia and Ukraine, falling by 11.7%, 11.1% and 10.6% respectively.

House prices have been declining steadily in Dubai over the last few years, affected by a drop in the price of oil, weaker currencies in Russia and Europe and a lack of housing demand.

1 http://www.telegraph.co.uk/finance/property/11871277/Revealed-the-countries-where-house-prices-are-rising-the-most.html

Average House Price to Reach £300,000 in the Next Three Months

Published On: September 22, 2015 at 2:21 pm

Author:

Categories: Property News

Tags: ,,,

The average UK house price could reach £300,000 in the next three months, according to Rightmove.

Low interest rates and a lack of supply have driven property prices to a new record high.

House prices rose by an average of £2,550 in September, the greatest September increase since 2002.

The property portal reported that the 15 most expensive counties, including Surrey, Hertfordshire and Oxfordshire, have experienced price growth double the national average, at 1.8% in September. Fewer homeowners in these places are deciding to sell their homes.

House price growth in the most expensive counties

Position County Average house price September 2015

Average house price August 2015

1 Surrey £545,841 £537,270
2 Hertfordshire £460,074 £460,956
3 Oxfordshire £437,042 £431,701
4 Buckinghamshire £432,692 £425,163
5 Berkshire £430,486 £422,546
6 West Sussex £375,155 £364,007
7 East Sussex £354,284 £352,730
8 Kent £341,585 £334,050
9 Essex £334,472 £324,220
10 Dorset £324,841 £320,529
11 Hampshire £321,589 £313,535
12 Cambridgeshire £291,636 £281,270
13 Avon £291,326 £285,419
14 Gloucestershire £290,478 £288,080
15 Somerset £288,413 £283,557

In the north, new vendors were down 4.9% and 7.1% in the south, adds Rightmove.

In London, the average house price is expected to hit £1m by 2020.

The average asking price in the capital was £620,003 in September, a 0.8% increase on the previous record set in July. The annual rate of growth is now 9.5%, or £53,923 per year, due to a shortage of supply and rising demand from international investors. If this pace continues, the average London home will cost £1m in 2020.

Director and Housing Market Analyst at Rightmove, Miles Shipside, says that this rate is not sustainable.

He explains: “While we are not suggesting that this level of growth can or will be maintained, this extrapolation illustrates the desperate need for more building and more affordable housing in and around the capital.”1

1 http://www.independent.co.uk/news/business/news/average-uk-house-price-to-hit-300000-in-the-next-three-months-10511047.html