Posts with tag: average house price

Annual House Price Growth Eased to 2.6% in June

Published On: July 7, 2017 at 9:54 am

Author:

Categories: Property News

Tags: ,,,

Annual house price growth eased to 2.6% in June, according to the latest House Price Index from Halifax.

This is down from the 3.3% annual rate of growth recorded in May, and is the lowest year-on-year increase since May 2013 (2.6%). The annual rate has dropped from a recent peak of 10.0% in March 2016.

On a quarterly basis, average house prices in the past three months (April to June) were 0.1% lower than the previous quarter (January to March). This was the third successive quarterly fall – the first time this has happened since November 2012.

Month-on-month, house prices dropped by an average of 1.0% between May and June – the first monthly decrease since January (-1.1%).

Nationally, house prices in June were 9.0% above their August 2007 peak. The current average house price of £218,390 is £63,727 (41.0%) higher than its low point of £154,663 in April 2009.

First time buyers
Annual House Price Growth Eased to 2.6% in June

Annual House Price Growth Eased to 2.6% in June

The number of first time buyers entering the market reached an estimated 162,704 in the first half of 2017 – just 15% below the peak recorded in 2006 (190,900).

The number of new buyers is up from 154,200 in the same period of 2016 and more than double the market low seen in the first half of 2009 (72,700).

This is the third time in four years that first time buyer numbers have exceeded 150,000 – the first time since 2007. 47% of all house purchases financed by a mortgage were made by first time buyers, found Halifax, compared with 36% a decade earlier.

Home sales

UK home sales edged down by 3.0% between April and May, to 100,170. However, sales have exceeded 100,000 in five consecutive months for the first time since March 2016.

Overall, sales in the three months to May were 1.0% higher than in the preceding three months.

Mortgage approvals

The volume of mortgage approvals for home purchases – a leading indicator of completed sales – rose by 0.2% between April and May, to 65,200. This is the first increase recorded since January, having dropped between February and April.

Approvals have remained in a narrow range between 65,200 and 68,600 per month over the last eight months, suggesting that home sales are likely to remain steady over the coming months.

Although employment levels continue to rise, household finances are coming under pressure, as inflation stands higher than wage growth. This development is likely to have weakened market activity, believes Halifax.

Housing supply 

The supply of homes for sale remains very low. New instructions for home sales fell for the 15th consecutive month in May, while the average stock levels on estate agents’ books are now at an all-time low.

The Housing Economist at Halifax, Martin Ellis, comments on the index: “House prices have flattened over the past three months. Overall, prices in the three months to June were marginally lower than in the preceding three months. The annual rate of growth has fallen to 2.6%; the lowest rate since May 2013.

“Although employment levels continue to rise, household finances face increasing pressure as consumer prices grow faster than wages. This, combined the new Stamp Duty on buy-to-let and second homes in 2016, appears to have weakened housing demand in recent months.”

He adds: “A continued low mortgage rate environment, combined with an ongoing acute shortage of properties for sale, should help continue to underpin house prices over the coming months.”

The Founder and CEO of eMoov.co.uk, Russell Quirk, also says: “Contrasting figures from Halifax, after Nationwide reported signs of a pulse returning to the UK property market, but given both sets of numbers, it would seem reports of a market demise have clearly been exaggerated.

“Despite the recent claims the market is due to see a notable crash with prices falling by as much as 40%, this remains very unlikely. The market is not dead or running on the life support of easily obtained credit, and has suffered more of a grazed knee than a fatal injury.

“A momentary blip is certainly not substantial enough to label as a trend, and those that have are doing so prematurely. Resilient levels of buyer demand, heightened by a paltry supply of stock and coupled with historically low-interest rates, will continue to fuel house price growth in the medium and long term.”
House Price Growth Regained Momentum in June, Reports Nationwide

Published On: June 28, 2017 at 9:22 am

Author:

Categories: Property News

Tags: ,,,

House price growth regained momentum in June, rising by 1.1%, according to the latest House Price Index from Nationwide.

June’s monthly increase reversed the previous three months’ declines.

Annual house price growth also rose over the month, from 2.1% to 3.1%.

The average house price in the UK stood at £211,301 in June, up from £208,711 in May.

Nationwide has also released its quarterly House Price Index, revealing that the gap in house price growth between the strongest and weakest performing regions in the second quarter (Q2) of the year is the smallest on record.

Q2 saw further convergence in regional house price growth. The gap between the weakest and strongest regions (in terms of annual price change) dropped to just four percentage points – a record low.

East Anglia was the strongest performing region in Q2, with average prices up by 5% year-on-year. London saw a notable slowing in growth, to 1.2%, and was the second weakest region in Q2, just above the north, at 1.1%.

Annual house price growth in Northern Ireland was stable, at 3.8%. Scotland experienced a slight softening in growth, to 1.7%, while Wales recorded similar levels to the previous quarter, at 1.4%.

House Price Growth Regained Momentum in June, Reports Nationwide

House Price Growth Regained Momentum in June, Reports Nationwide

Average house prices in England fell by 0.3% during Q2, but were up by 2.8% over the last 12 months.

For the first time in eight years, house price growth in northern England (the West Midlands, East Midlands, Yorkshire and the Humber, the North West, and the north) exceeded that of southern England (the South West, outer South East, outer Metropolitan, London, and East Anglia). Northern England recorded a 3.3% annual rise, while prices were up by just 2.6% in the south.

Regional growth rates may have converged, but Nationwide continues to report significant disparities in price levels. This is particularly apparent when looking at prices relative to their 2007 peaks.

For example, prices in London are around 55% above their 2007 levels, while those in the north, Yorkshire and the Humber, and the North West are still below 2007 levels.

The Chief Economist at Nationwide, Robert Gardner, comments on the latest figures: “UK house prices rebounded in June, with prices rising by 1.1% during the month, erasing the decline recorded over the previous three months. However, monthly growth rates can be volatile, even after accounting for seasonal effects.

“The annual rate of house price growth, which gives a better sense of the underlying trend, continues to point to modest price gains. Annual house price growth edged up to 3.1% from 2.1% in May. In effect, after two sluggish months, annual price growth has returned to the 3-6% range that had been prevailing since early 2015.”

He continues: “There has been a shift in regional house price trends. Price growth in the south of England has moderated, converging with the rates prevailing in the rest of the country. In Q2, the gap between the strongest performing region (East Anglia, which saw 5% annual growth) and the weakest (the north, with 1% growth) was the smallest on record, based on data going back to 1974. Nevertheless, when viewed in levels, the price gap between regions remains extremely wide.

“London saw a particularly marked slowdown, with annual price growth moderating to just 1.2% – the second slowest pace of the 13 UK regions and the weakest pace of growth in the capital since 2012.”

Gardener explains: “The emerging squeeze on household incomes appears to be exerting a drag on housing market activity in recent months. The number of mortgages approved for house purchase has slowed a little in recent months and surveyors report that new buyer enquiries have softened.

“At this point, it is unclear whether the increase in house price growth in June reflects strengthening demand conditions on the back of healthy gains in employment and continued low mortgage rates, or whether the lack of homes on the market is the more important factor. While survey data suggests that new buyer enquiries have softened, it also indicates that this has been matched by a decline in new instructions. Indeed, the number of properties on estate agents’ books remains close to all-time lows.”

He looks ahead: “Given the ongoing uncertainties around the UK’s future trading arrangements, the economic outlook remains unusually uncertain, and housing market trends will depend crucially on developments in the wider economy.

“Nevertheless, in our view, household spending is likely to slow in the quarters ahead, along with the wider economy, as rising inflation squeezes household budgets. This, together with ongoing housing affordability pressures in key parts of the country, is likely to exert a drag on housing market activity and house price growth in the quarters ahead.

“However, the subdued level of building activity and the shortage of properties on the market are likely to provide support for prices. As a result, we continue to believe that a small increase in house prices of around 2% is likely over the course of 2017 as a whole.”

Hannah Maundrell, the Editor in Chief of money.co.uk, also responds to the data: “Looking at month-on-month changes to the housing market without factoring in annual performance can give us an unrealistic picture, because it’s partly reliant on which properties sold during the month. This could explain the turnaround Nationwide’s price index shows.

“The devil is in the detail however, and there are signs the property market is cooling slightly, with fewer people putting their property for sale and a drop in the number of people looking to buy. This is no great surprise; with the election thrusting us deeper into uncertainty, it’s sensible to be cautious.”

She adds: “If you’re looking to buy, the power is tipping in your balance, so make sure you do your research and haggle to get a price you’re happy with. If you’re selling, make sure the price you’re asking is realistic and be confident about the minimum you’re able to accept. If you want to sell at the top end of the price scale, you’ll need to make sure your home is better than anything else out there, and be prepared to wait for someone that wants to pay a premium.”

House Prices Up on an Annual Basis in April, Show Official Statistics

Published On: June 13, 2017 at 9:17 am

Author:

Categories: Property News

Tags: ,,,

House prices rose by an average of 5.6% in the year to April 2017 – 1.1 percentage points higher than in the 12 months to March, show the latest official statistics from the Land Registry and Office for National Statistics (ONS).

On a monthly basis, prices rose by 1.5% in April, taking the average value across the UK to £220,094.

Regionally, the largest house price growth in April was recorded in the East of England (8.1%), while the lowest was in the North East (0.6%).

House prices increased by 4.7% in London in the 12 months to April – 1.5 percentage points higher than in the year to March. This is the first time in 11 months that the rate of price growth in the capital has risen.

House Prices Up on an Annual Basis in April, Show Official Statistics

House Prices Up on an Annual Basis in April, Show Official Statistics

These figures are consistent with data from the Royal Institution of Chartered Surveyors (RICS), which has reported negative price expectations in London for the 13 months to April 2017.

Looking at housing demand, RICS’s residential market survey for April shows that buyer enquiries remained low.

In April, the total number of seasonally adjusted property sales completed in the UK with a value of £40,000 or above rose by 20.3% compared with April 2016.

The unusually low level of transactions recorded in April last year was associated with the introduction of the Stamp Duty surcharge on additional properties. Comparing April 2017 to April 2016, sales fell by 3.2%.

According to the Bank of England agent’s summary of business conditions report for May, housing market activity was subdued on both the demand and supply side.

Regarding supply, RICS reports that new sales instructions remained negative for the 14th consecutive month. It also states that average estate agent stock levels remain close to record lows. Furthermore, RICS claims: “An acute shortage of stock remains a key factor underpinning prices for the time being.”

The Founder and CEO of online estate agent eMoov.co.uk, Russell Quirk, comments on the data: “The latest Government data seems to portray a healthier market than other industry sources on the surface, with the monthly rate of growth bucking the downward trends seen in the previous month to climb 1.6%. That said, transactional volume was down on a month–on-month basis, and it is reported that both buyer and seller demand dwindled, no doubt a knee-jerk reaction to the news of a snap election.

“Although the events of the last year, particularly the changing political landscape, do not seem to have had a long-lasting detrimental impact on the UK property market, they have certainly stunted the rate of price growth.”

He adds: “Many UK homeowners and buyers for that matter would have been waiting for the election outcome to provide an air of stability in which to conduct their transaction. The reality, for the immediate future at least, will not provide that, and it is likely that the unpredictable swings in house price growth seen over the last few months will now persist for a while longer.”

The Senior Economist at PwC, Richard Snook, also says: “In the first set of numbers released since the General Election, the official ONS and Land Registry house price data showed that average UK house price inflation rose to 5.6% in the year to April, from an upwardly revised 4.5% in March (initially reported as 4.1%).

“This increase goes against the general pattern of slowing growth since summer 2016, as average UK prices leapt by £3,500 in the month, from £216,600 in March to £220,100 in April.”

Snook continues: “There was broad based strengthening across the regions – in particular, annual growth in London rose from 1.5% reported in March to 4.7% in April. Meanwhile, in Scotland, prices surged by £8,000, from £138,000 in March to £146,000 in April. This is the biggest monthly gain since this series began in 2005.

“These figures go against the recent trend of a Brexit-related slowdown that we predicted last year, but remain consistent with our guidance of 2%-5% growth in 2017 as a whole.”

Annual House Price Growth Eases Again, to 3.3%

Published On: June 7, 2017 at 9:54 am

Author:

Categories: Property News

Tags: ,,,

Annual house price growth eased again in May, to 3.3%, according to the latest House Price Index from Halifax.

The rate of growth recorded last month was lower than in April and is the lowest annual rate seen since May 2013 (2.6%). It is around a third of the 10.0% peak hit in March 2016.

On a quarterly basis, house prices in the three months to May were 0.2% lower than in the preceding quarter. This is the second quarterly decline since November 2012 (0.3%).

Month-on-month, there has virtually been no change in prices, at 0.4%.

Nationally, house prices in May were 11% above their August 2007 peak. The average house price of £220,706 is now £66,043 (43%) higher than its low point of £154,663 in April 2009.

Annual House Price Growth Eases Again, to 3.3%

Annual House Price Growth Eases Again, to 3.3%

The House Price Index also found that sales dropped by 3% between March and April this year, to 99,910. This followed three successive months when sales were above 100,000. Nonetheless, sales in the three months to April were 2% higher than in the previous three months.

The volume of mortgage approvals for house purchases – a leading indicator of completed home sales – fell by 2% between March and April, to 64,600.

Approvals have been in a narrow range between 64,600 and 68,600 per month over the past six months, suggesting that home sales are unlikely to change significantly over the next few months.

Rising inflation and weak wage growth, alongside higher Stamp Duty rates for buy-to-let and second property purchases, have weakened market activity, reports Halifax.

However, supply still remains very low. The number of properties coming onto the market decreased for the 14th consecutive month in April. This kept the average stock level on estate agents’ books close to historic lows.

Nevertheless, a rise in private sector housebuilding has been recorded. Private enterprise new build housing completions rose by 12% in the first quarter (Q1) of this year, compared with the previous quarter. In contrast, completions by housing associations were 5% lower. All completions are 57% above the low seen in Q1 2013, but remain 18% lower than their Q1 2007 peak.

The Housing Economist at Halifax, Martin Ellis, says: “After reaching a recent peak of 10% in March 2016, the annual house price growth has since fallen to 3.3% in May.

“House prices have again fallen over the past three months. Overall, prices in the three months to May were 0.2% lower than in the preceding three months; the same rate as in April.

“The fact that the supply of new homes and existing properties available for sale remains low, combined with historically low mortgage rates and a high employment rate, is likely to support house price levels over the coming months.”

The Founder and CEO of online estate agent eMoov.co.uk, Russell Quirk, also comments: “Despite many predicting a second consecutive monthly drop in house price growth, the latest numbers by Halifax show that prices have, in fact, crept up ever so slightly during May, notwithstanding a marginal fall in the last quarter.

“The unpredictability of recent house price trends demonstrates the turbulent landscape that both the UK property market, along with the wider economy, have had to traverse over the last year or so. With the snap election looming imminently, the recent cool in price growth seems to be thawing and it is no coincidence that one of the overarching factors in the recent price growth slowdown has been a shortage of stock, more so than usual.”

He adds: “Tomorrow’s vote will be pivotal in shaping the future of the UK housing market. However, regardless of which way it goes, it is likely that the sector will receive a boost from the many home sellers and buyers who, until now, will have been putting their decision on hold until the election dust has settled.”

eMoov has recently accessed which political party has been best for the property market since 1970: /best-political-party-house-price-growth/

Which has been the Best Political Party for House Price Growth Since 1970?

Published On: June 6, 2017 at 8:12 am

Author:

Categories: Property News

Tags: ,,,,

Ahead of Thursday’s (8th June) General Election, online estate agent eMoov.co.uk has taken a look at which political party has been the best for house price growth since 1970.

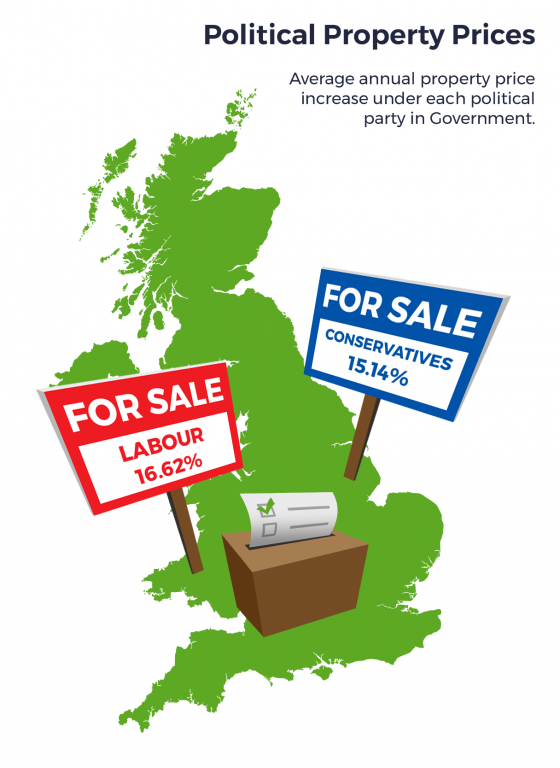
The agent analysed historic house price data to determine which majority government – Labour or Conservative – has had the greatest impact on house price growth per year during their reigns across all 650 parliamentary constituencies.

When the Conservative government first took power in June 1970, the average UK house price was just £4,508. Almost half a century later, and today’s Conservative Government oversees a very different economic landscape. In the past 47 years, house prices have surged by 4,724.80% to the current average of £217,502.

But despite the Conservatives currently overseeing a housing crisis – caused by their inability to build the homes needed to meet buyer demand – historically they aren’t the best party for UK homeowners who want to see the values of their properties climbing. This, in fact, is the Labour Party, which has seen house price growth of 16.62% per year of its reign, to the Conservative’s 15.14%.

House price growth since 1970 

Conservatives: 1970-1974 

Which has been the Best Political Party for House Price Growth Since 1970?

Which has been the Best Political Party for House Price Growth Since 1970?

During the Conservative’s initial majority government, led by Edward Heath, house prices rose by 120.23% – 30.06% for each of the four years, which is the largest rate of growth per year to date.

Labour: 1974-1979 

Labour then governed over a slightly lower rate of price growth across a similar timeframe, split between Harold Wilson and James Callaghan, with prices up by 92.14% between 1974-1979 – an increase of 18.43% per year.

Conservatives: 1979-1997 

A Conservative government then followed for 18 consecutive years, first led by Margaret Thatcher, who saw house prices rise by 187.91% between 1979-1990, before John Major ruled the next seven years, pushing the total price increase under the Conservatives to 206.18% – the highest total growth since 1970, but an average of just 11.45% a year.

Labour: 1997-2010

Under the 21-year reign of Tony Blair and Gordon Brown’s Labour governments, the total increase in house prices hit 192.53% – a rise of 14.81% per annum.

Conservatives: 2010-now

In the past seven years, under a Conservative majority government, house prices have increased by just 27.31%, as the market has slowed from the extreme rates recorded over the last three decades. This equates to an average increase of just 3.90% per year.

Highest and lowest growth under Labour 

The constituencies to have seen the slowest rate of house price growth under Labour since 1970 are Airdrie and Shotts, Coatbridge, Chryston and Bellshill, and Motherwell and Wishaw. All three are located north of the border in Scotland and all have seen price growth of just 13.56% under Labour governments.

The highest growth was seen in North Down in Northern Ireland, at 24.59%, with the top ten highest constituencies under a Labour government all located in Northern Ireland.

Highest and lowest growth under the Conservatives

The constituency to have recorded the lowest house price growth per year under a Conservative government is Pendle in the North West – up by just 8.39%.

Since 1970, the top ten lowest constituencies for annual house price growth under a Conservative majority government are all located in the North East or North West.

Somewhat expectedly, the constituency to have seen the greatest annual rate of house price growth under a Conservative government is Kensington, at 33.87%. In fact, the top 125 constituencies to have recorded the highest rates of house price growth are all located in London, the South East or East of England.

The Founder and CEO of eMoov, Russell Quirk, comments on the findings: “This research really isn’t trying to highlight that one party is better than the other, but more which party is better for the UK populace, depending on their current residential situation.

“All the major parties have attempted to address housing in the run-up to this month’s election, but have outlined very little other than the usual empty promises on building and which, let’s face it, has historically ensured a rapidly rising rate of house price growth in itself. One wonders whether successive governments have purposely sought to strangle housing supply to encourage value growth and therefore a tail wind of voter enthusiasm for their particular political colour at successive elections?

“Therefore, we thought it important that both buyer and seller alike have something else to base their decision to vote on, that was at least based on fact, albeit historical evidence.”

He continues: “If you are in the privileged decision of owning a home in the UK, Labour is the party to ensure your bricks and mortar assets continue to appreciate. If you are a struggling aspirational buyer, then on the face of it the Conservatives are marginally better where a lower rate of price growth is concerned and to better enable you a foothold on the property ladder.

“Of course, the UK picture will vary drastically when considering individual constituencies, so we would suggest looking at the wider data set to see how the two differ in house price performance for your local area.”

Asking Prices Hit Record High, Particularly for First Time Buyers

Published On: April 24, 2017 at 9:38 am

Author:

Categories: Property News

Tags: ,,,,

Asking prices hit a record high in April, with homes targeted at first time buyers driving growth, according to the latest House Price Index from Rightmove.

Asking Prices Hit Record High, Particularly for First Time Buyers

Asking Prices Hit Record High, Particularly for First Time Buyers

Figures from the property portal show that the average new asking price reached a record high of £313,655 in April, up by 2.2% on an annual basis and exceeding the previous peak of £310,471 recorded in June 2016.

Typical first time buyer asking prices surged by 6.5% in the 12 months to April, reaching an average of £194,881.

Second stepper properties rose in value by an average of 3.1% over the year, to hit £265,940, while those at the top of the ladder increased by 1.8%, to an average of £555,963.

Rightmove also reports that sales agreed – based on properties listed as sold subject to completion – rose by 10% year-on-year, which is the highest level at this time of year since 2007.

This helped average time on the market drop from 71 days in February to 65 in March, while stock increased from 52 to 65 over the same period.

The Director of Rightmove, Miles Shipside, comments: “High buyer demand in most parts of the country has helped to propel the price of newly marketed property to record highs.

“There are signs of a strong spring market, with the number of sales agreed achieved at this time of year being the highest since 2007.”

He continues: “It remains to be seen what effect the run-up to the snap election will have, though any slowdown in activity will be counterbalanced by the market’s current fast pace. Indeed, in locations where choice of suitable property is limited, hesitation could mean losing out to others who still decide to act.”

Shipside predicts that stretched buyer affordability will continue to be a price moderator for vendors who are over-ambitious with their pricing, alleviating the pace of price growth.

He adds: “Strong buyer activity this month has led to 10% higher number of sales agreed than in the same period in 2016. This large year-on-year disparity should be viewed cautiously, as the comparable timespan in 2016 saw a drop in buy-to-let activity with the additional second home Stamp Duty.

“However, they are also up by 3.8% when compared to 2015. With the growth in household numbers and new build supply struggling to keep pace, demand is strong and has led to the highest sales agreed numbers at this time of year since the heady pre-credit crunch levels.”