Home » Uncategorised »
Which has been the Best Political Party for House Price Growth Since 1970?
This article is an external press release originally published on the Landlord News website, which has now been migrated to the Just Landlords blog.
Ahead of Thursday’s (8th June) General Election, online estate agent eMoov.co.uk has taken a look at which political party has been the best for house price growth since 1970.
The agent analysed historic house price data to determine which majority government – Labour or Conservative – has had the greatest impact on house price growth per year during their reigns across all 650 parliamentary constituencies.
When the Conservative government first took power in June 1970, the average UK house price was just £4,508. Almost half a century later, and today’s Conservative Government oversees a very different economic landscape. In the past 47 years, house prices have surged by 4,724.80% to the current average of £217,502.
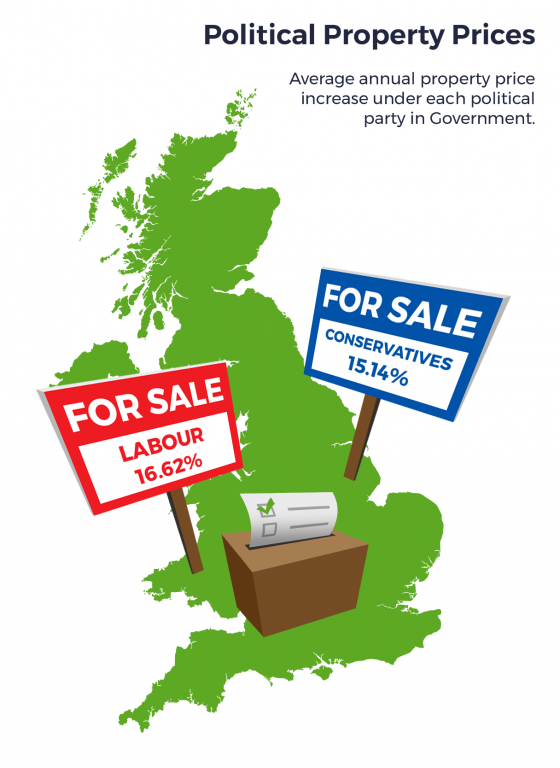
But despite the Conservatives currently overseeing a housing crisis – caused by their inability to build the homes needed to meet buyer demand – historically they aren’t the best party for UK homeowners who want to see the values of their properties climbing. This, in fact, is the Labour Party, which has seen house price growth of 16.62% per year of its reign, to the Conservative’s 15.14%.
House price growth since 1970
Conservatives: 1970-1974
Which has been the Best Political Party for House Price Growth Since 1970?
During the Conservative’s initial majority government, led by Edward Heath, house prices rose by 120.23% – 30.06% for each of the four years, which is the largest rate of growth per year to date.
Labour: 1974-1979
Labour then governed over a slightly lower rate of price growth across a similar timeframe, split between Harold Wilson and James Callaghan, with prices up by 92.14% between 1974-1979 – an increase of 18.43% per year.
Conservatives: 1979-1997
A Conservative government then followed for 18 consecutive years, first led by Margaret Thatcher, who saw house prices rise by 187.91% between 1979-1990, before John Major ruled the next seven years, pushing the total price increase under the Conservatives to 206.18% – the highest total growth since 1970, but an average of just 11.45% a year.
Labour: 1997-2010
Under the 21-year reign of Tony Blair and Gordon Brown’s Labour governments, the total increase in house prices hit 192.53% – a rise of 14.81% per annum.
Conservatives: 2010-now
In the past seven years, under a Conservative majority government, house prices have increased by just 27.31%, as the market has slowed from the extreme rates recorded over the last three decades. This equates to an average increase of just 3.90% per year.
Highest and lowest growth under Labour
The constituencies to have seen the slowest rate of house price growth under Labour since 1970 are Airdrie and Shotts, Coatbridge, Chryston and Bellshill, and Motherwell and Wishaw. All three are located north of the border in Scotland and all have seen price growth of just 13.56% under Labour governments.
The highest growth was seen in North Down in Northern Ireland, at 24.59%, with the top ten highest constituencies under a Labour government all located in Northern Ireland.
Highest and lowest growth under the Conservatives
The constituency to have recorded the lowest house price growth per year under a Conservative government is Pendle in the North West – up by just 8.39%.
Since 1970, the top ten lowest constituencies for annual house price growth under a Conservative majority government are all located in the North East or North West.
Somewhat expectedly, the constituency to have seen the greatest annual rate of house price growth under a Conservative government is Kensington, at 33.87%. In fact, the top 125 constituencies to have recorded the highest rates of house price growth are all located in London, the South East or East of England.
The Founder and CEO of eMoov, Russell Quirk, comments on the findings: “This research really isn’t trying to highlight that one party is better than the other, but more which party is better for the UK populace, depending on their current residential situation.
“All the major parties have attempted to address housing in the run-up to this month’s election, but have outlined very little other than the usual empty promises on building and which, let’s face it, has historically ensured a rapidly rising rate of house price growth in itself. One wonders whether successive governments have purposely sought to strangle housing supply to encourage value growth and therefore a tail wind of voter enthusiasm for their particular political colour at successive elections?
“Therefore, we thought it important that both buyer and seller alike have something else to base their decision to vote on, that was at least based on fact, albeit historical evidence.”
He continues: “If you are in the privileged decision of owning a home in the UK, Labour is the party to ensure your bricks and mortar assets continue to appreciate. If you are a struggling aspirational buyer, then on the face of it the Conservatives are marginally better where a lower rate of price growth is concerned and to better enable you a foothold on the property ladder.
“Of course, the UK picture will vary drastically when considering individual constituencies, so we would suggest looking at the wider data set to see how the two differ in house price performance for your local area.”