Posts with tag: average house price

The Average Property Price in Each London Borough Following Brexit

Published On: August 11, 2016 at 11:21 am

Author:

Categories: Property News

Tags: ,,,

The Average Property Price in Each London Borough Following Brexit

The Average Property Price in Each London Borough Following Brexit

Although the Brexit result caused uncertainty in the housing market and we are still awaiting its full impact, property prices in London are expected to remain robust.

For those with properties in London, these volatile market conditions may have caused concern over the value of your assets. But fear not, recent house price data from Rightmove suggests that the London property market is staying strong.

Over the past few years, London has seen constant double-digit growth in house prices, leading to many people being priced out of the market.

In the year to May, Land Registry figures show that this trend continued for two-thirds of London’s boroughs.

However, during this period, the more affluent boroughs of the capital recorded either very modest growth or declines in house prices. Islington and Hammersmith & Fulham recorded rises of 4.7% and 2.7% respectively, while prices were own by 9.2% and 2.5% in the City of London and Kensington and Chelsea.

Ahead of June’s Brexit vote, this slowdown in the prime central London market was widely attributed to an oversupply of luxury homes and the higher 12% Stamp Duty rate for properties priced over £1.5m. With these factors continuing to have an effect on the market, it is no surprise that the prime market remains slow. However, the latest figures from Rightmove show that this trend is rippling out to higher-priced properties over London.

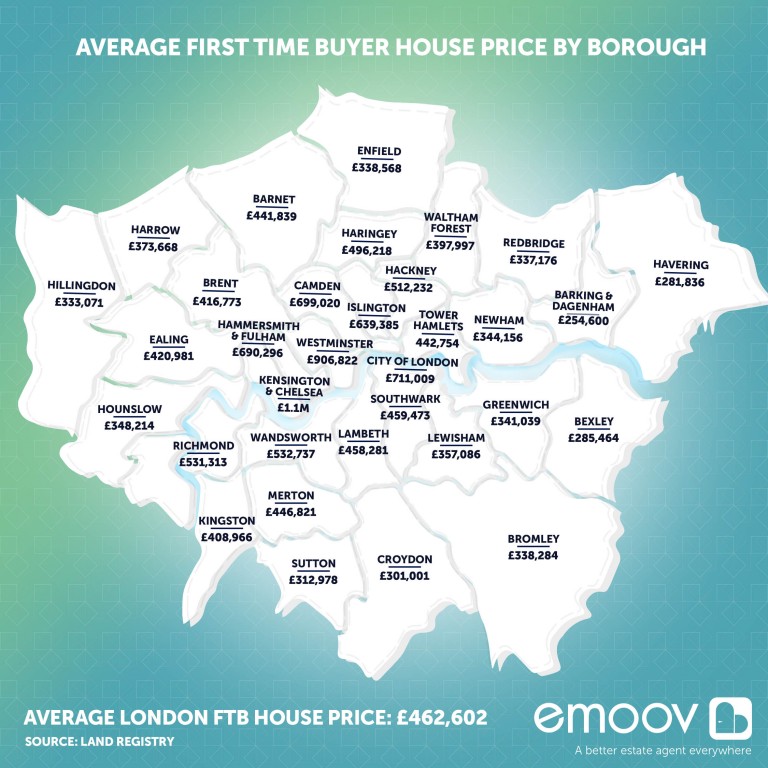
The following data highlights the average house price in each London borough post-Brexit.

The average property price in each London borough

[table id=21 /]

Following the cooling in the market ahead of the Brexit and further uncertainty about the impact of the vote in the past month, it is easy for property owners to expect the worst.

However, Nina Skero, of the Centre for Economics and Business Research (Cebr), has some good news: “Although Brexit has certainly sent shockwaves, Cebr expects the housing market to slow down but not plummet.”

The consultancy expects house prices to continue growing this year and from 2018 onwards, but has forecast a 5.6% decrease next year.

Simon Rubinsohn, the Chief Economist at the Royal Institution of Chartered Surveyors (RICS) has predicted a similar dip, but has positive long-term expectations: “Prices are expected to rise, albeit a little less than previously anticipated, with a cumulative increase of 14% projected for the next five years.”

Even if the former Chancellor, George Osborne’s predictions of an 18% decrease is realised, this would only mean a return to last year’s house price levels for much of London, which is not a catastrophe.

Additionally, the sky-high house prices in the capital are continuing to keep many prospective homebuyers out of the property market, which is good news for landlords.

However, those hoping for property prices in the capital to plummet could be disappointed – as long as demand outweighs supply, the London housing market will remain as resilient as ever.

Drop in Property Transactions Caused by Stamp Duty, Not Brexit, Says LSL

Published On: August 11, 2016 at 8:35 am

Author:

Categories: Property News

Tags: ,,,,

Drop in Property Transactions Caused by Stamp Duty, Not Brexit, Says LSL

Drop in Property Transactions Caused by Stamp Duty, Not Brexit, Says LSL

Property transactions dropped by 20% in the second quarter (Q2) of the year, caused by the rush to purchase ahead of the Stamp Duty deadline in April, rather than the Brexit vote, reports LSL/Acadata.

The report suggests that the annual decrease in house sales has more to do with the tumble recorded after the 3% Stamp Duty surcharge was introduced than uncertainty surrounding the EU referendum in June.

The study found that although annual house price growth slowed to 5.5% in July, transaction levels edged up over the past month. The average house price in the UK now stands at £293,318.

Although the huge spike in sales recorded in March caused a massive decline in April, sales in the first half of the year are still likely to be 4% higher than in the same period last year.

The report claims that the “exceptional” sales level seen in March has more than compensated for the decrease since.

It also points out that while property transactions rose in July, the Land Registry would have recorded these figures before the EU referendum took place.

The Director of Your Move and Reeds Rains, which are owned by LSL, Adrian Gill, comments: “Brexit may well have an impact on the housing market, but it’s not showing yet.

“Even when it does, there will be positive as well as negative influences on the market, which clearly has some strong long-term drivers for continued house price inflation.”

According to the research, house prices increased by an average of 0.2% in July, making it the fifth consecutive month that the annual rate of house price growth has dropped. Despite this, the 5.5% rise in house prices over the year has added an average of £15,422 to property values.

An Analyst at Acadata, Peter Williams, says: “The market was contracting pre-Brexit and the question remains, how will it perform post the Brexit vote and ultimately, on exit?”

Do you believe that the Stamp Duty surcharge has had more of an impact on property transactions than the Brexit vote? How have you been affected?

Has the Property Market Lost Steam?

Published On: August 5, 2016 at 9:51 am

Author:

Categories: Property News

Tags: ,,,,

The latest Halifax House Price Index reports that the average UK house price has dropped by 1% over the past month, following the Brexit vote. But does this mean that the property market has lost steam?

Between June and July, the average house price in the UK fell from £216,726 to £214,678 – a slight decline of 1%. However, prices in the three months to July are still 8.4% higher than in the same period of 2015.

Additionally, prices in the past three months were 1.6% higher than in the preceding three months. This is above June’s 1.1% increase, and similar to the rates of growth recorded in April and May (both 1.5%), but significantly lower than in February and March.

Has the Property Market Lost Steam?

Has the Property Market Lost Steam?

However, the annual rate of growth, 8.4% in the three months to July, is unchanged from June, and is the lowest level since July 2015.

While house prices fell between June and July, following a 1.2% increase in June, Halifax claims that monthly changes can be erratic and falls often occur within an upward trend. Although this was the third monthly decline seen this year, it was lower than February’s 1.5% decrease.

The Housing Economist at Halifax, Martin Ellis, comments on the data: “House prices in the three months to July were 1.6% higher than in the previous quarter, up from 1.1% in June, but comfortably lower than earlier in the year. The annual rate of growth was unchanged at 8.4%; the lowest since July 2015.

“There are signs that house price growth is slowing, with a deceleration in both the annual and quarterly rates of increase in the past few months. Nonetheless, the current rates remain robust.”

He adds: “July’s monthly decline largely offsets June’s increase. The month-on-month changes, however, can be erratic and falls often occur within an upward trend. Overall, it remains too early to determine if there has been any impact on the housing market as a result of June’s EU referendum result.”

Halifax has also recently released its First Time Buyer Review. The report found that the number of first time buyers increased by around 10% in the first half of the year, compared with the same period in 2015.

There were an estimated 154,200 first time buyers in the first six months of 2016, compared with just 140,500 in the first half of last year. This was more than double the market low recorded in the first half of 2009 (72,700), but is almost a fifth lower than ten years ago, in 2006.

In response to the latest figures, the founder and CEO of eMoov.co.uk, Russell Quirk, comments: “This is the first full damage assessment of the UK property market by Halifax since Britain hit the Brexit iceberg back in June.

“Although it would seem the UK property market has lost steam since the vote, with prices dropping 1% since last month, the summer period is always a traditionally slower time of year for residential property transactions.”

He continues: “With prices still up 8.4% year-on-year, there’s no real evidence that UK homeowners need to jump ship just yet, and so I would urge them to remain calm and avoid any rash decisions.

“Once the market picks back up in a couple of months’ time and the Brexit uncertainty starts to subside, I’m confident the previous upward trend in value enjoyed by UK homeowners will continue.

“In the meantime, this slight slowdown in price growth, coupled with yesterday’s rate cut by the Bank of England, make it an ideal time for those considering a property purchase to strike while the iron is hot. Or slightly cooled in this case.”

House Price Growth Steady in July, but Future Uncertain

Published On: July 28, 2016 at 10:51 am

Author:

Categories: Property News

Tags: ,,,

House price growth remained at a steady 0.5% in July, according to the latest House Price Index from Nationwide. However, the data suggests that the future of the property market is uncertain following the Brexit.

In the first month’s data following June’s EU referendum, Nationwide reveals that monthly house price growth stands at 0.5%, compared to 0.2% in June, while annual inflation is virtually unchanged, at 5.2% from 5.1%.

The average house price in the UK is now £205,715, up from £204,968 in June.

House Price Growth Steady in July, but Future Uncertain

House Price Growth Steady in July, but Future Uncertain

Although the figures could be used to determine the effects of the Brexit vote on the property market, the Chief Economist at Nationwide, Robert Gardner, explains that the data used in this report is from the mortgage offer stage. This means that any impact from the vote may not be fully evident yet, as there is a short lag between a buyer’s decision to purchase a property and applying for a mortgage.

In addition, the index states that a slowdown in activity was expected over the summer months, following a surge in property sales ahead of the 1st April Stamp Duty deadline for buy-to-let landlords and second homebuyers. It adds that it will be difficult to determine how much of the fall back in activity is the result of these tax changes and how much is due to the referendum.

Gardner also points out that the future of the property market looks unusually uncertain at this time.

“In the near term, increased economic uncertainty may lead to weaker demand for homes. Leading indicators are consistent with softening ahead. Household confidence fell sharply in the wake of the referendum result, especially attitudes towards making major purchases, which in the past has correlated with mortgage activity, though less closely in recent years. In the run up to the vote, the Royal Institution of Chartered Surveyors (RICS) reported declines in new buyer enquiries and expectations of weaker price growth amongst surveyors, though these trends pre-date the vote and are likely to have been impacted by the recent tax changes, as well as the referendum.”

He continues: “How the labour market evolves will be crucial in determining the demand for homes in the quarters ahead. It is encouraging that conditions were robust in the run up to the vote, with the unemployment rate falling to a ten-year low in the three months to May. The decline in long-term interest rates to new all-time lows in recent weeks should also help to keep borrowing costs low and provide some support for demand.

“Even if there is a fall back in demand as a result of economic uncertainty, the impact on house prices is not certain, as potential sellers may also hold off from placing their properties on the market. The stock of homes on estate agents’ books is already close to its lowest levels for 30 years, and surveyors have reported a decline in new instructions to sell alongside a fall in buyer enquiries. Moreover, housebuilders may react to the uncertainty by delaying construction, even though home building is already failing to keep up with the natural increase in the population.”

Gardner concludes: “The outlook for the housing market remains unusually uncertain and it may take several months for the underlying trends in the market to become evident.”

The founder and CEO of eMoov.co.uk, Russell Quirk, also comments on the new data: “The first evidence of the post-apocalyptic Brexit property market and on the face of it, not a lot to worry about, with prices up 0.5% monthly and 5.2% annually.

“Yes, this isn’t a huge rate of growth, but prices are still continuing the upward trend enjoyed since 2012. That’s not to say there won’t be any impact, as the likes of Nationwide and Halifax usually report on somewhat of a lag, due to the use of mortgage offers data, not cold hard completions.

“This said, the UK property market is one of the strongest in the world and historically, house prices are higher than July 2014 and July 2015, so it’s looking pretty healthy across the board.”

He notes: “It’s important UK home sellers take any Brexit doomsayers and their forecasts with a pinch of salt and avoid acting irrationally where the sale of their home is concerned.

“We are entering a traditionally slower time for the property market, and so this cool in price rate growth is always likely to happen during the summer months. Once September rolls around again, we predict things will start to pick up and prices will continue their sharp ascent.”

The Best Locations for First Time Buyers Revealed

Published On: July 28, 2016 at 8:41 am

Author:

Categories: Property News

Tags: ,,,,,

In its latest analysis of the UK property market, hybrid estate agent eMoov.co.uk has highlighted the best locations for first time buyers in England, and where they should avoid.

Using Land Registry figures, eMoov has mapped the average first time buyer house price across each English county and each of London’s boroughs, as well as calculating the average increase in value since 2012.

The study found that first time buyers are now paying an average of just over £196,000 for their home. However, in the last four years, the average price paid across England by those getting onto the property ladder has risen by £42,451.

This substantial 28% increase beats the average rate of growth for England as a whole, where the typical house price has risen by 26% over the same period, highlighting the ever-growing obstacle facing first time buyers.

But it’s worse news for those hoping to get onto the ladder in London, where the average first time buyer house price is a whopping £462,602, up by 54% on 2012.

So where should first time buyers look to buy, where should they avoid, and which location has seen the greatest increase in house prices in the past four years?

England 

Average first time buyer prices across England

Average first time buyer prices across England

At just £86,116, County Durham is home to the lowest house price for first time buyers. Although low demand has caused price drops in the area, this has benefitted those trying to buy their first home.

However, those thinking of buying in County Durham should be aware that its poor performance is notable – prices have risen by just 3% (£2,600) since 2012, the lowest rate across England and a far cry from the national average.

Naturally, the City of London and Greater London are the most expensive counties for first time buyers. However, the capital’s commuter zone also proves out of reach for many buyers. Surrey (£323,973), Hertfordshire (£305,043), Berkshire (£292,227), Oxfordshire (£286,962) and Buckinghamshire (£286,511) make up the top five most expensive counties for first time buyers outside of London, with each location seeing house price growth of between £80,000-£96,000 since 2012 – the greatest increases outside of the M25.

London 

London's first time buyer house prices

London’s first time buyer house prices

Living in London comes at a high price, even in the most affordable boroughs. First time buyers looking for a home in the capital will find that the average price across even the cheapest boroughs is still much higher than the UK average.

At £254,600, Barking and Dagenham is the most affordable borough for first time buyers. Havering comes in second place (£281,836), followed by Bexley (£285,464), Croydon (£301,001) and Sutton (£312,978). In 2012, the average first time buyer house price for these boroughs came in at under £200,000, but each location has experienced an increase of between £95,000-£118,000 in the last four years.

Unsurprisingly, Kensington and Chelsea (£1.1m) is the most expensive spot in the capital for first time buyers. Westminster (£906,882), the City of London (£711,009), Camden (£669,020) and Hammersmith & Fulham (£690,296) complete the top five.

The founder and CEO of eMoov, Russell Quirk, comments on the findings: “First time buyers are paying almost as much as second and third steppers in actual price terms, yet the percentage increase in first time buyer properties is tracking at even greater than regular house prices. It really does highlight the issue facing the nation’s next generation of aspirational homeowners.

“How the Government expects anyone to get on in life when the first hurdle they face is all but unobtainable, to begin with, is beyond me, especially in London. Over 90% of the capital’s boroughs have seen the price paid by first time buyers increase by more than £100,000 in just four or so short years.”

He urges: “We must address this issue and find a way to bring homeownership back in reach of the average homebuyers, not just in London, or the surrounding commuter counties, but to the whole of England.”

Landlords, remember that many young people in the UK are stuck in rental properties. Ensure that you offer a safe and suitable home to hopeful first time buyers, and set a reasonable rent price.

Highest London House Price Growth Under Thatcher and Blair

Published On: July 26, 2016 at 8:39 am

Author:

Categories: Property News

Tags: ,,,,

The highest London house price growth occurred when the country was under Margaret Thatcher and Tony Blair, according to new analysis from estate agent Stirling Ackroyd.

Recently, we looked at what the new Prime Minister, Theresa May, will mean for the housing market: /will-theresa-mays-government-mean-housing-market/. However, it is expected that the Brexit could mar her time as PM.

A spiralling market

The average London home cost just £31,370 in 1979 when Margaret Thatcher entered 10 Downing Street. Just 11 years later, this had soared to £110,110 – a whopping rise of 251%. For each year that Thatcher was PM, house prices in the capital grew by an average of 12.1%.

But Thatcher isn’t alone in overseeing a spiralling London property market.

Highest London House Price Growth Under Thatcher and Blair

Highest London House Price Growth Under Thatcher and Blair

Tony Blair’s time as PM saw the average house price in London surge from £108,620 in 1997 to £335,040 just ten years later, putting him in second place. During his term, London house price growth averaged 11.9% per year.

The Managing Director of Stirling Ackroyd, Andrew Bridges, says: “With great power comes great responsibility, but there’s one thing the PM can’t control – London house prices.

“Under Thatcher’s tenure, the property market was turned on its head – seeing dramatic house price growth in London. There’s always talk of spiralling house price growth in the capital, but compared to the 1980s, the rate of growth is lagging behind.

“Even the boom years under Blair couldn’t keep up with this pace of growth. Under New Labour, London’s property market reached new heights and became a global competitor. As demand soared, so did prices. Places like Shoreditch became solid investments and a buy-to-let surge started, with those properties snapped up still returning a profit today.”

Recessions bite

For PMs that governed during a recession, it’s been a very different story. House prices in London fell by 1.4% between Thatcher and the end of John Major’s term. In 1991, the average home in the capital cost £110,110, falling to £108,620 at the time Major left office. However, financial difficulty prevented buyers from taking advantage of the drop in house prices.

Similarly, Gordon Brown, who inherited a sharp global recession, also oversaw negative house price growth during his time as PM. When he entered No. 10 in 2007, a typical London home cost £335,040. By 2010, property had become more affordable, at £332,720.

One of the world’s most expensive cities

David Cameron’s time as PM saw the price of a London home increase by 53%, as the capital became a safe-haven for international property investors. In 2010, buyers paid £332,720 for the average home, rising to £507,880 this year.

Bridges concludes: “Buyers in London have paid the price under Cameron’s leadership. House prices started rising swiftly again, and, despite a return to strong economic growth, affordability has become the number one issue for Londoners. Once again, the supply of homes could not keep up with demand and economic growth.

“If the pattern developing over the last 38 years is anything to go by, Theresa May could face a static London property market. The City’s property sphere has been pushed to its limits with new legislation and political events in the last. But there’s a new advantage – London’s property market is more resilient and probably the safest real estate investment globally. The comparisons of May and Thatcher have already begun – but London’s property market can be tamed by no one.”