Posts with tag: average house price

House Prices Would Fall by 20% if We Vote to Leave, Warns Zoopla

Published On: June 20, 2016 at 8:39 am

Author:

Categories: Property News

Tags: ,,,

House prices would fall by 20% if we vote to leave in Thursday’s EU referendum, warns property portal Zoopla.

The prediction appeared in yesterday’s Mail on Sunday, which has been fighting a fierce remain campaign.

House Prices Would Fall by 20% if We Vote to Leave, Warns Zoopla

House Prices Would Fall by 20% if We Vote to Leave, Warns Zoopla

Zoopla believes that a Brexit would wipe out nearly all of the house price gains made over the past five years, leaving some homeowners in negative equity.

The property portal says that the average house price, of just over £297,000, would drop by more than £53,000 if we vote to leave, due to the combined effect of uncertainty, increased unemployment, reduced investment and higher borrowing costs.

Altogether, a Brexit vote would cut £1.5 trillion off the total value of the UK’s housing stock, warns Zoopla.

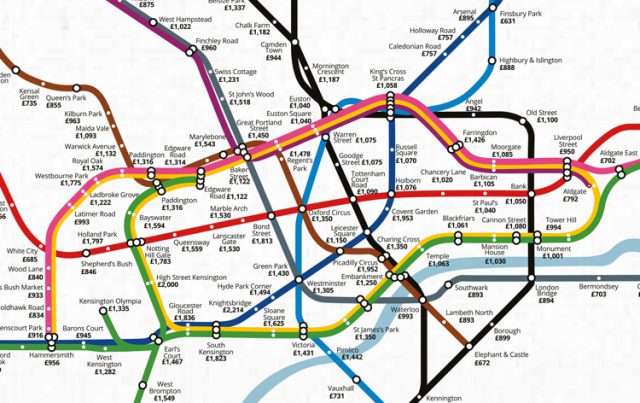
In London, Zoopla claims that the average house price, currently at £671,989, would decrease to £550,989. Meanwhile, in the South East, it believes that prices would fall from £396,682 to £325,282.

Even in the region with the lowest house prices, Yorkshire and the Humber, the average would decline from £167,023 to £137,023.

Zoopla states that its calculations, based on Treasury projections, suggest that “most of the gains clawed back since the credit crisis would be wiped out, leaving homeowners with less equity and some in negative equity territory”.

While the portal puts the average house price at £297,000, the latest figures from the Office for National Statistics and Land Registry indicate that the average price in England is significantly lower, at £225,000.

Although the dramatic drop in house prices forecast by Zoopla would not be good news for homeowners, many members of the public responded positively to the article.

One reader wrote: “Great. It’s about time prices went down.”

Another added: “Excellent – house prices are beyond stupid and getting worse. If leaving the EU gets them back to a more sensible level then that is another reason for voting to leave.”

Average House Price Per Square Foot on the London Underground

Published On: June 19, 2016 at 8:23 am

Author:

Categories: Property News

Tags: ,,,

We’re all aware about how high house prices in London are, but this new Tube map highlights the spiralling costs of living in the capital.

If you’re thinking of buying a property in London, this reimagined Underground map details exactly how much it costs on average to purchase a home near each Tube station.

TotallyMoney.com has put together the handy, if depressing, map to show the average house price per square foot within 0.3 miles of every London Underground station.

To put it into context, the average one-bedroom flat in the capital is around 500 square feet – with many areas on the map costing over £1,000 per square foot, it’s not difficult to realise that you’re going to need a hefty mortgage and a huge deposit to secure a property in London.

The map shows that the Hammersmith & City line is the most expensive in the capital, with an average price of £1,125 per square foot. Meanwhile, the Metropolitan line is home to the cheapest property price, at £504 per square foot.

However, it is worth noting that the Metropolitan line stretches into zone 9, meaning that although you will save on house prices, you will have a seriously long and expensive commute.

The latest Government data puts the average house price in London at £470,000. However, online estate agent eMoov claims that less than half of all homes in the capital are priced at the average value or below. Therefore, it may be more difficult to find an affordable home than you think.

Unsurprisingly, ahead of next week’s EU referendum, property sales have halved in prime central London, as buyers face the uncertainty of the vote.

And the news isn’t any better for tenants in the capital – according to one London estate agent, the average renter spends a huge 70% of their income on rent and bills.

Use the handy map above to find out where you can afford to buy a property in London.

One in Five London Properties Cost £1m or More

Published On: June 17, 2016 at 8:41 am

Author:

Categories: Property News

Tags: ,,,

One in five London properties has a price tag of £1m or more, according to the latest research into the capital’s housing market by online estate agent eMoov.co.uk.

The study found that the plethora of properties priced at £1m or more are spread throughout all London boroughs except one, Barking and Dagenham.

Previous research by eMoov highlighted how little of London’s housing stock is priced at the average value or below.

One in Five London Properties Cost £1m or More

One in Five London Properties Cost £1m or More

London is widely considered the most expensive city in the world due to the high level of £1m-plus high-rise apartments and townhouses. eMoov’s latest analysis of the market has revealed that 20% of all properties currently listed for sale in the capital cost £1m or more.

The online agent has assessed current stock levels across all of the major property portals, recording the total numbers listed for each London borough, before comparing this to the level of stock priced at £1m or more. It also calculated the percentage of stock across the capital as a whole.

Unsurprisingly, Westminster recorded the highest level of £1m-plus properties, at 63% of all stock, closely followed by Kensington and Chelsea at 62%.

However, despite the ever-increasing price of property in London, there is still one borough in the capital where not a single property has hit the £1m mark. Barking and Dagenham is yet to see any of its properties reach £1m.

And although the surrounding boroughs are home to a few £1m-plus properties, the following have recorded low levels: Newham (1%), Bexley (1%), Waltham Forest (1%), Redbridge (2%), Havering (2%), Lewisham (3%) and Greenwich (5%).

The founder and CEO of eMoov, Russell Quirk, comments: “When people think of London, they accept prices are through the roof. Even though the average house price in Barking and Dagenham is considerably lower than the London average, at £253,000, it still trumps the UK average by tens of thousands of pounds. In a market as inflated as London, where stock is scarce and demand is overwhelming, it’s quite remarkable that there is still an entire borough without even one property at the £1m mark or over.

“With prices across London continuing to rise, surely it won’t be long before Barking and Dagenham will see some of its properties priced at £1m or above. Despite this, our latest research shines yet another spotlight on how unaffordable London is from a property point of view.”

He adds: “When you consider that across a city as vast and as populated as London, one in every five properties will cost you a six-digit price tag, it really is disheartening for the aspiring London homeowner.”

EU Referendum Has Little Effect on House Price Growth

Published On: June 15, 2016 at 8:39 am

Author:

Categories: Property News

Tags: ,,,

The forthcoming EU referendum is having little effect on house price growth across the UK, according to the Resolution Foundation.

In response to the Government’s latest house price data, the organisation reports that there is little sign of a slowdown in growth, despite uncertainty surrounding the EU referendum and concerns over whether a housing bubble could burst.

The house price index found that the average UK house price rose by 8.2% in the year to April. The Resolution Foundation believes that the rush to purchase buy-to-let properties ahead of the introduction of the 3% Stamp Duty surcharge on 1st April has only marginally reduced the rate of growth, down from 8.5% in March.

EU Referendum Has Little Effect on House Price Growth

EU Referendum Has Little Effect on House Price Growth

Similarly, signs of property market confidence declining, particularly in London, have not yet fed through into house prices.

The Resolution Foundation has found that across the UK, house prices have increased by more than 2.5 times the rate of average weekly earnings growth since April 2011. The average house price rose by 24% over the last five years, while weekly earnings have increased by just 9% in the same period.

London continues to dominate when it comes to the difference between incomes and house prices, with property values rising by 15% in the last year alone. However, the body warns that the contrast between incomes and house prices is not unique to the capital, with other parts of the country, such as the East of England, also under stress.

The Senior Policy Analyst at the Resolution Foundation, Lindsay Judge, says: “Despite the turbulent political background, house prices continue to rise sharply. Hopes that the house price hare would slow down and allow tortoise-paced income growth to catch up are not showing up in today’s data.

“The wedge between house prices and incomes continues to grow with real implications for living standards for many households. Large parts of the UK remain unaffordable for below-average earners hoping to buy.”

The Director of e.surv chartered surveyors, Richard Sexton, also comments on the data: “There has been a noticeable stumble ahead of the EU referendum, but the housing market remains in great shape. UK house prices have certainly come a long way over the last couple of years, and in this era of flexibility and adaptability, there’s little sign of a sustained let-up. This growth has not just centred around London; it’s spilling out across the nation, with the East and South East looking to challenge the capital’s housing prowess.

“Despite the short-term uncertainty of next week’s EU referendum, regional property markets are receiving a pre-summer swell, giving homebuyers more choices. And whilst a lift in prices doesn’t spell completely bad news – marking real demand and strong local housing momentum – it does mean more work is needed for first time buyers. As deposits climb alongside asking prices, the housing market demands a new flexibility from lenders in assessing affordability and creditworthiness.”

Sexton adds: “But whilst this is already happening, driving growth out to the regions around London, many prospective buyers are looking further afield. The North East is a land of opportunity, with lower growth and prices just over half of the UK average. Small-deposit lending totalled 18.4% across the UK in May, so for those prepared to take a leap of faith and venture out of the capital, lenders are keen to help.”

House Prices Continue to Rise, Especially in London

Published On: June 14, 2016 at 10:40 am

Author:

Categories: Property News

Tags: ,,,,

House prices in the UK are continuing to rise, especially in London, which remains the region with the greatest house price growth, according to the latest UK House Price Index for April from the Office for National Statistics (ONS) and the Land Registry.

In the year to April, the average house price rose by 8.2%, down slightly from 8.5% in the year to March.

The main contribution to house price growth in the UK came from England, where the average property value increased by 9.1% over the past 12 months to reach £225,000.

House Prices Continue to Rise, Especially in London

House Prices Continue to Rise, Especially in London

Regionally, London continues to be the region with the highest average house price, at £470,000, followed by the South East, at £302,000, and the East of England, at £263,000.

The lowest average house price continues to be in the North East, at £122,000.

London was also the region that recorded the greatest annual house price growth, of 14.5% in the year to April.

The East of England, at 13.6%, and the South East, at 12.3%, also experienced strong annual growth.

The lowest annual growth was seen in the North East, where prices rose by just 0.1% over the last 12 months.

The CEO of estate agent Marsh & Parsons, David Brown, comments: “This new, combined house price index gives a more accurate picture than ever before, given the inclusion of cash sales and new dwellings, along with average price calculations that are less liable to volatility. The revised methodology doesn’t scramble the signal, however; house price growth continues the strong performance it has shown over the past two-and-a-half years, despite a slight calming since March.

“The rate of house price growth in the capital has been overshadowed at various junctures over the past year by strong showings from the East of England and the South East, but London is top dog once again. A truly world-class destination like London may not always be at full throttle, but it never loses its lustre.”

Additionally, the Managing Director of property firm Stirling Ackroyd, Andrew Bridges, says: “London’s property crown is intact – for now. Unparalleled growth in house prices and unwavering demand mean a home in the capital now demands more than double the UK average. High prices aren’t putting off buyers, with the capital’s diverse variety of homes proving hard to resist. But this could be the calm before the storm.

“A potential Brexit is producing jitters this June, and the London property market is the most vulnerable to this new anxiety. The top-end of the capital’s housing market has been stuck in a slowdown for a while now, with a 2.4% annualised fall in the last quarter of 2015. And this is worsening, as buyers and sellers wait to see the referendum result – at least for the top-end of London’s luxury market.”

He adds: “But this is a temporary drop, and London’s ability to bounce back is in no doubt. Buyers may be flirting with the idea of buying in the cheaper and newer areas around the capital. But London’s overall draw, for both domestic and international buyers, is undimmed. And the challenge of political developments will be unable to thwart the capital’s global property reign.”

House Price Growth Broadly Stable in May Following Stamp Duty Surge

Published On: June 1, 2016 at 8:41 am

Author:

Categories: Property News

Tags: ,,,

House price growth was broadly stable in May, following an artificial surge in property transactions due to the new Stamp Duty surcharge, according to the latest House Price Index from Nationwide.

Property prices rose by just 0.2% over the past month to reach an average of £204,368, taking annual house price growth to 4.7%.

A surge in property transactions in March, ahead of the 1st April Stamp Duty deadline, pushed prices up artificially.

As of April, buy-to-let landlords and second homebuyers are now charged an extra 3% in Stamp Duty. Many rushed to purchase additional properties before being hit with the higher tax rate.

Nationwide now expects to see a steady increase in housing market activity following this flood.

House Price Growth Broadly Stable in May Following Stamp Duty Surge

House Price Growth Broadly Stable in May Following Stamp Duty Surge

The building society’s Chief Economist, Robert Gardner, comments: “The annual pace of house price growth remains in the fairly narrow range between 3-5% that has been prevailing for much of the past 12 months.

“In the near term, it’s going to be difficult to gauge the underlying strength of activity in the housing market, due to the volatility generated by the Stamp Duty changes, which took effect from 1st April.

“Indeed, the number of residential property transactions surged to an all-time high in March, some 11% higher than the pre-crisis peak, as buyers of second homes sought to avoid the additional tax liabilities.”

He continues: “While cash purchases accounted for a significant proportion of the increase in activity, it is not possible to determine whether or not these were purchased by landlords. Mortgage data suggests that, while buy-to-let purchases were a major driver of the increase, the purchase of second homes also accounted for a substantial proportion.

“House purchase activity is likely to fall in the months ahead, given the number of purchasers that brought forward transactions. The recovery thereafter may also be fairly gradual, especially in the buy-to-let sector, where other policy changes, such as the reduction in tax relief for landlords from 2017, are likely to exert an ongoing drag.

“Nevertheless, healthy labour market conditions and low borrowing costs are expected to underpin a steady increase in housing market activity once Stamp Duty-related volatility has passed, providing the economic recovery remains on track.”

The founder and CEO of online estate agent eMoov.co.uk, Russell Quirk, responds to the figures: “Despite the artificial skew of April’s Stamp Duty deadline having been and gone, UK house prices have continued the upward trend that has been prevalent over the last year, increasing month-on-month again, albeit gradually.

“There has been a lot of talk about how the market may come to a shuddering halt now that April’s spike in activity is behind us, however, I don’t believe that this will be the case.

“There’s no denying that April’s change in Stamp Duty thresholds created an abnormality in market activity, but I don’t think it has brought about the death of the buy-to-let and second home market, let alone the UK market as a whole.”

He explains: “When you also consider that we are entering what is seasonally the busiest time of the year for property transactions, I think the engine room of Britain’s property market will continue to trundle along at a steady pace, even if it does take a while longer to get up to speed than it may have in previous years.

“Whilst interest rates remain at a mouth-watering low and the Government continues to pump this feel-good factor into the UK economy, the dangerous imbalance between housing demand and supply will remain out of kilter and continue to push house prices up. Britain remains an aspirational home owning nation, and neither an EU yes or no vote will change that.”