Posts with tag: average house price

House Price Growth Down Across England

Published On: December 13, 2016 at 11:51 am

Author:

Categories: Property News

Tags: ,,,

House price growth is down on a monthly basis across England, according to the latest House Price Index from the Land Registry and the Office for National Statistics (ONS).

In the UK as a whole, house prices have risen by 6.9% in the last year and 0.1% over the month to October.

House Price Growth Down Across England

House Price Growth Down Across England

However, this trend is reversed in England, as prices have dropped by 0.1% month-on-month. Nevertheless, growth still stands at 7.4% on an annual basis.

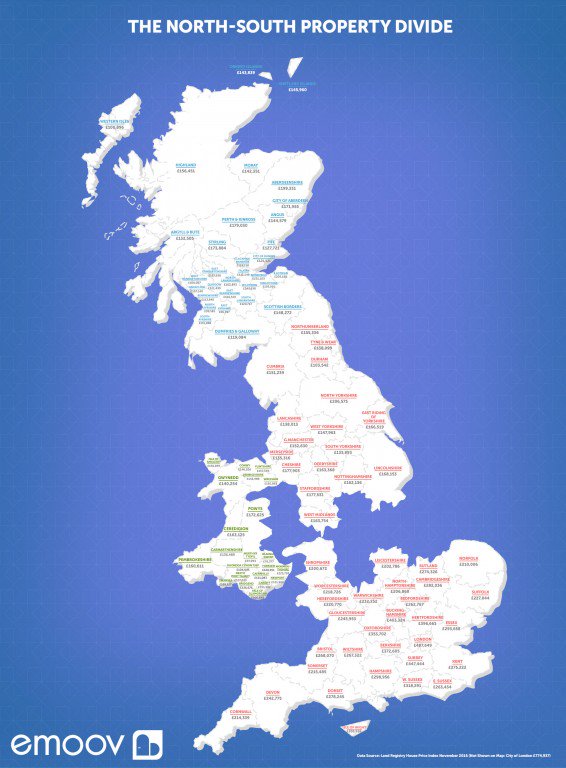
The annual rate of growth is only marginally higher in the capital, at 7.7%, with London house prices falling by a significant 1.2% between September and October.

The East of England enjoyed the greatest monthly and annual growth, while the North East experienced the greatest month-on-month decline, as well as the slowest annual increase.

Russell Quirk, the Founder and CEO of eMoov, comments on the latest index: “It would seem that London has taken a backseat when it comes to the driving force behind UK house price growth, having suffered a 1.2% drop month-on-month, despite monthly growth creeping up by 0.1% across the UK as a whole.

“The industry will really start to stutter to a halt now as Christmas fast approaches, and so any panic over falling house prices should really be taken with a pinch of salt. Not only will buyer demand drop right off as thoughts turn to the stress of the festive season, but many sellers will also freeze the marketing of their property, ready to hit the ground running again in January.”

He continues: “Although there is a great marketing push behind the Boxing Day bounce, and the number of people that log on after the Queen’s speech to surf the property portals, this has little benefit to actual sellers, as those full of Christmas merriment are unlikely to be serious in their search. So it really is worthwhile to enjoy your time with friends and family and prepare for the onslaught of buyer interest that will come with the New Year.”

The Senior Economist at PwC, Richard Snook, also has his take on the recent figures: “The final official housing release from the ONS and Land Registry before Christmas shows that average UK house inflation was 6.9% in the year to October – barely changed from 7.0% in September. This takes the average price of a UK home to £217,000.

“Whilst the annual inflation rate remains high, prices have barely moved over the last three months. If this trend continues into 2017, we will see a pronounced drop in growth rates in the New Year. We project that UK house price growth for 2017 could range between 2-5%.

“The picture was mixed across the regions, with monthly price declines of over 1% in London, the North East and the North West. However, monthly growth is volatile and it is too early to call a slowdown in these areas.”

We will continue to keep you updated of any changes to house price growth across the UK at Landlord News.

The North-South Property Price Divide Defined

Published On: December 2, 2016 at 10:03 am

Author:

Categories: Property News

Tags: ,,,,

Last week, Chancellor Philip Hammond set out further plans to boost the Northern Powerhouse in an attempt to close the north-south divide. But, in terms of property price, where does this divide start and finish?

Online estate agent eMoov.co.uk has used the latest data from the Land Registry to provide a definitive answer.

The agent recorded the current average property price across each county, finding that there is a clear £200,000 boundary that separates the north and south of the nation – other than North Yorkshire, two areas in Scotland and two in Wales.

The split begins at Bristol in the West Country, running up the border with Wales, through Herefordshire and Shropshire, before cutting back down through Worcestershire below the West Midlands, by Leicestershire and Rutland, to Norfolk and the east coast.

The North-South Property Price Divide Defined

The North-South Property Price Divide Defined

The border where the north meets the south acts as a clear mark where the UK’s over-inflated property market begins to lose steam, placating to a more affordable level.

The divide is apparent when it comes to the average property price between the north and south, as well as the rate of house price growth.

South of the border, the average property costs £295,395, having risen by 9% in the past year. This drops to £146,344 and an increase of 4% in the north. Removing Scotland and Wales from the equation sees a slight increase to £155,410 and growth of 5%.

The Founder and CEO of eMoov, Russell Quirk, explains the study: “Of course, this research is only valid where property prices are concerned, and doesn’t consider the further economic criteria that divide the north and south of the UK. However, with the divide often discussed across the industry itself, it’s important that there be a clearer definition of what and where it actually is.

“It is widely considered that the north is playing catch-up with the south where the divide is concerned and, of course, there is good reason property may command a higher price in particular areas of the UK.”

He adds: “However, for many struggling to get that first foot on the ladder, this research highlights the additional hurdles facing those south of the line and, in this instance, why heading north is a much more attractive proposition. Yes, property prices are climbing at a slower rate, but that is of little concern to those that don’t own a property.”

Despite Quirk’s warning regarding first time buyers, recent research shows that first time buyer sales in October were at the highest level on record.

Nationwide Reports Further Slowdown in House Prices in November

Published On: December 1, 2016 at 10:22 am

Author:

Categories: Property News

Tags: ,,,

House prices have slowed yet again, according to the November House Price Index from Nationwide.

Although house prices rose by 0.1% on a monthly basis in November, the annual rate of growth has decreased from 4.6% in October to 4.4%. The average house price in the UK now stands at £204,947, down from £205,904 in the previous month.

House price growth in line with 2015

The Chief Economist at Nationwide, Robert Gardner, explains the figures: “UK house prices increased by 0.1% in November, after taking account of seasonal factors. As a result, the annual rate of house price growth slowed slightly to 4.4%, from 4.6% in October, though this is in line with the growth rates prevailing since early 2015.

Nationwide Reports Further Slowdown in House Prices in November

Nationwide Reports Further Slowdown in House Prices in November

“There are some signs that, despite the uncertain economic outlook, demand conditions have strengthened a little in recent months, reflecting the impact of solid labour market conditions and historically low borrowing costs. Mortgage approvals increased in October, and surveyors report that new buyer enquiries have increased modestly.

“The relatively low number of homes on the market and modest rates of housing construction are likely to keep the demand/supply balance fairly tight in the quarters ahead, even if economic conditions weaken, as most forecasters expect.”

Fixed rate mortgages most popular 

Gardner looks at the mortgage market: “Fixed rate mortgages have remained the most popular product type by a considerable margin in recent years. Data from the Council of Mortgage Lenders suggests that over 90% of new mortgages were contracted on fixed rates over the past 12 months. This may be driven by a desire to lock in record low interest rates.

“The proportion of new mortgage lending contracted on fixed rates has increased considerably since the low point in 2010, when less than half of lending was on fixed rates. In recent years, the proportion of lending accounted for by fixed rate deals has persisted at levels well above those prevailing before the financial crisis.”

He continues: “Fixed rate deals are most popular amongst first time buyers, for whom certainty over monthly payments is likely to be particularly important. Indeed, over the past 12 months, 95% of new mortgage lending to first time buyers was on fixed rates.

“Borrowers taking out fixed rate mortgages have benefitted from historically low interest rates. For example, in October, the average two-year fixed rate (for those with a 25% deposit) was 1.51% – over two percentage points below the level prevailing in 2012. Moreover, for borrowers with a 10% deposit, two-year fixed rates are currently the lowest on record, at 2.42%.”

The Founder and CEO of online estate agent eMoov.co.uk, Russell Quirk, responds to the latest house prices report: “It would seem that UK buyers are setting a tentative first foot out of their post-Brexit foxholes with a modest increase in new buyer enquiries, just as home sellers, who have remained prominent in the market all year, decide to avoid this seasonal property cold snap and go into hibernation until 2017.

“The UK property market has really taken a battering from a multitude of influences this year, causing uncertainty in the sector, and it has weathered the storm, with prices still maintaining their upward trend this late in the year, albeit slowing the pace.”

He adds: “However, just like the current temperatures, the market will now see stock levels plummet as many choose to put their sale on hold over the festive season and resume their marketing in the New Year. We expect this might see a drop in prices at the last hurdle for 2016 in the December index, although this will be far from unusual and nothing to panic over.”

London is Driving House Price Growth Yet Again, Shows Latest Data

Published On: November 15, 2016 at 11:10 am

Author:

Categories: Property News

Tags: ,,,

London is driving house price growth across the UK yet again, shows the latest official data from the Office for National Statistics (ONS)/Land Registry.

The figures for September – the most recent available – show an annual price increase of 7.7% across the UK as a whole, taking the average property value to £217,888. On a monthly basis, prices have risen by 0.2% since August.

House price growth

In England, prices rose by 8.3% year-on-year, to an average of £234,250. Since August 2016, prices were up by 0.2%.

Wales experienced an annual price increase of 4.4%, taking the average property value to £146,388. Month-on-month, prices rose by 0.2%.

In London, however, house price growth stood at 10.9% on an annual basis, pushing the average value up to £487,649. The capital experienced the greatest rate of monthly growth, at 1.4%, meaning it is now driving the UK yet again.

Annually, the East of England saw the greatest increase in property values, at 12.1%.

The North East experienced the lowest rate of annual growth, at just 1.5%. It also recorded the most significant monthly decline in prices, of 1.9%.

Average house prices by region

[table id=28 /]

Home sales

Between August and September, home sales dropped by 4.3%, with levels remaining lower than those seen in 2014, 2015, and before the Stamp Duty changes earlier this year.

London is Driving House Price Growth Yet Again, Shows Latest Data

London is Driving House Price Growth Yet Again, Shows Latest Data

Sales during July 2016, for which the most recent Land Registry figures are available, dropped by 28.1% in England, from 93,040 in July 2015 to 66,870.

The number of completed home sales in Wales fell by 23.4%, from 4,603 to 3,525 this year.

In London, home sales declined by a huge 43.3%, from 12,481 in July 2015 to 7,074.

There were 490 repossession sales in England in July 2016, and 54 in Wales.

The lowest number of repossession sales in England and Wales was in the East of England.

Commenting on the latest House Price Index, the Senior Economist at PwC, Richard Snook, says: “We now have three months of post-Brexit official housing figures, which show price growth remaining robust, but fewer properties changing hands. At the start of the year, we expected slower house price growth, but in fact, it has shown impressive resilience; in the first three quarters of the year, average annual house prices were up by around 8% across the UK compared to the same period last year.

“But high prices are causing some buyers to stay out of the market altogether. The ONS data shows residential transactions in September were just 93,000 – 11.3% lower than the previous year. This implies that underlying demand may be weakening as property becomes less and less affordable.”

The Founder and CEO of eMoov.co.uk, Russell Quirk, also comments: “Interesting to see London back behind the wheel and driving the UK property market once again, with the largest monthly increase. This, along with a number of other industry data sets, shows that the capital suffered from wobbly knees post-referendum, but now seems to have well and truly found its feet again. It will be interesting to see if, a few reports from now, Trump’s victory has any notably direct influence on the UK property market.

“We predict a slight price peak at the top end of the market, particularly in London, but little more than that. Elsewhere across the country, strong annual growth all-round.”

He adds: “Interestingly, the UK seems to be suffering from some form of property paralysis across the east, with both the south and North East seeing a monthly fall in prices, along with Yorkshire and the Humber.”

eMoov Crowns I’m a Celebrity Winner Based on Property Values

Published On: November 14, 2016 at 10:21 am

Author:

Categories: Property News

Tags: ,,,

With I’m a Celebrity…Get Me Out of Here back on our screens, online estate agent eMoov.co.uk has completed its latest piece of topical research by crowning the winner based on property values.

The agent took the birthplace of each of the ten contestants (other than Polish-born Ola Jordan, who now lives in Maidstone) and ranked them based on the change in the average property values since the show aired last year. In the event of a tie, eMoov took into account which hometown offers the most affordable house price.

eMoov Crowns I'm a Celebrity Winner Based on Property Values

eMoov Crowns I’m a Celebrity Winner Based on Property Values

After analysing each of the contestants, eMoov crowned Jordan Banjo as the new King of the Jungle. The Diversity dance star may no longer be a household name, but his birthplace of Wickford, near Basildon, has experienced an increase of 21% in property values over the last 12 months – the greatest growth by far.

In second place, and Banjo’s Queen of the Jungle, is Carol Vorderman. Her birthplace of Bedford has seen a rise of 15% in property values over the last year, enough to tie her with the third and fourth place contestants, Lisa Snowden and Larry Lamb.

However, with an average house price of £264,257, Vorderman beats Lisa and Larry to the second spot with a more affordable property value.

Both Lisa, who was born in Welwyn Garden City, and Larry, who was born in Edmonton, Enfield, have the most expensive average house prices of all the contestants, at £381,280 and £396,630 respectively.

England football star Wayne Bridge came out in fifth, with the average house price in his birthplace of Southampton (£201,464) affordable enough to bat off Joel Dommet (South Gloucestershire, £258,689) and dancer Ola Jordan (Maidstone, £280,256) in a three-way tie, with each location enjoying a 12% increase in property values over the past year.

Actor Adam Thomas takes eighth place, with the average house price in his hometown of Manchester standing at £154,711 – up by 9% over the last 12 months.

Olympian Sam Quek narrowly missed out on last place, with her birthplace of the Wirral only experiencing an increase in property values of 4% in the last year.

Sadly, bookies favourite Scarlett Moffatt’s birthplace of Bishop Auckland in County Durham only saw house prices creep up by 2% over the past year, placing her last in the rankings.

Russell Quirk, the Founder and CEO of eMoov, says: “Although most of these celebrities will have long left their hometowns and moved on to more affluent parts of the UK property market, we thought it was important to rank them on where they came from, not where they’ve made it to.

“Historically, it seems to be the most genuine contestants that have the right recipe for I’m a Celeb royalty. Should this be the case, we could well see our table reversed when it comes to the real thing.”

He adds: “The property market in County Durham has taken a bit of a battering over the last year or two, so it would be great if Scarlett could bring home the crown and give the area something to cheer about.”

Who are you behind to win this year’s competition?

House Price Growth Slows Again to 5.2%

Published On: November 7, 2016 at 9:36 am

Author:

Categories: Property News

Tags: ,,

House price growth has slowed yet again, to 5.2% on an annual basis, according to the latest House Price Index from Halifax.

Quarter-on-quarter, prices rose by just 0.1%. However, this is a slight improvement on last month’s decrease of 0.1%. The quarterly rate of growth has dropped from a peak of 3% in February.

Average house price

Following a monthly change of 1.4% between September and October, the average house price now stands at £217,411.

House Price Growth Slows Again to 5.2%

House Price Growth Slows Again to 5.2%

October’s 5.2% rate of growth is the lowest annual increase recorded since July 2013 (4.6%), reports Halifax.

However, the monthly rise seen in October marks the second consecutive month of growth.

Property market activity

Home sales have broadly stabilised over the past few months. Despite monthly fluctuations, sales have largely plateaued in recent months following the distortions seen earlier in the year, caused by the rush to complete on purchases ahead of the introduction of higher Stamp Duty for additional properties.

Nevertheless, home sales in the third quarter (Q3) were 8% lower than the same period last year, indicating an overall softening in activity.

Mortgage approvals have also steadied, reports Halifax. The volume of mortgage approvals for house purchases – a leading indicator of completed sales – rose in September; the first monthly increase for four months.

Overall, the amount of approvals seems to have broadly stabilised over the last three months, albeit at a lower level than a year ago. Approvals in Q3 2016 were 12% lower than in Q3 2015.

The bank also reports that supply remains historically low. Housing stock was largely flat over the three months from July to September, but remains around the lowest levels ever recorded.

The Housing Economist at Halifax, Martin Ellis, comments: “House prices in the three months to October were largely unchanged compared with the previous quarter. The annual rate of growth continued on its recent downward trend, easing to 5.2%.

“Activity levels, like house price growth, have softened compared with a year ago. Home sales, however, appear to have stabilised in recent months, following the distortions earlier in the year due to the changes to Stamp Duty in April.”

He continues: “Annual house price growth has nearly halved from a peak of 10% in March this year, but remains robust at 5.2%. This expected slowdown appears to have been largely due to mounting affordability pressures, which have increasingly constrained housing demand. Whilst house price growth may ease further in the coming months, very low mortgage rates and a shortage of properties available for sale should help support price levels.”

The Co-Founder and Director of online mortgage lender LendInvest, Ian Thomas, also responds to the index: “October has seen a flattening out of house price growth, with a real effect of the Stamp Duty changes feeding through to reduced market demand. This is something that we are seeing the industry call on the Government to address in the upcoming Autumn Statement and housing white paper publication.

“Many are forecasting that the property market may see a slowdown, as the uncertainty around Britain’s withdrawal from the European Union impacts on customer confidence.”