Posts with tag: Football

The Premier League of House Price Growth

Published On: August 10, 2017 at 8:15 am

Author:

Categories: Property News

Tags: ,,

With the Premier League returning this weekend and turning 25 next Tuesday, online estate agent eMoov.co.uk has ranked the teams based on annual house price growth in their local area.

The alternative league tables also look at how some of the biggest footballing rivalries match up head-to-head where the property market is concerned.

The last 25 years

Over the past 25 years, the average UK house price has soared by 302%.

Across the 20 teams in the Premier League this year, the average house price stands at £272,447, having risen by 4.55% since the last season.

Although homes in Premier League locations cost over £50,000 more than the UK average (£220,713), the higher price of property means that growth rates are marginally trailing the UK over the last year (4.67%).

Premier League table 

When looking at this year’s 20 Premier League teams where house price growth is concerned, it’s Manchester United that returns to its former glory, with the highest increase in the league, at 8.58%, and an average property value of £262,997.

Although Burnley struggled to stay up after promotion last year, the Lancashire team is flying high where house price growth is concerned. The team lost out to the top spot by the smallest of margins, with prices having risen by 8.57% in the last year. Despite this, Burnley is home to the most affordable property value in the league, at just £77,525.

The North West also takes third place in the league, with Manchester City seeing prices climb by 8.08%. Leicester flies the flag for the East Midlands, with an increase of 7.76%, and newly promoted Brighton performs well, as the best team in the south, after prices rose by 7.12% annually.

The Premier League of House Price Growth

The Premier League of House Price Growth

Coincidentally, the two teams to open the footballing season in last week’s charity shield are also home to the lowest rate of price growth. A tough year for the London property market means that Chelsea and Arsenal are the only two teams to see annual house price growth slump below 1% (0.40%), with Newcastle heading straight back down into the third relegation spot (1.39%).

Footballing rivalries 

Arsenal vs. Tottenham

Despite Arsenal seeing the lowest level of price growth in the Premier League, its rival Tottenham has seen prices rise by 4.5% in the past year.

But with its temporary move to Wembley this year, it could be a different story at the end of the season, with Brent – home of Wembley Stadium – having seen growth of just 0.90% annually.

Elsewhere in London, West Ham’s new home at the London Stadium means that it’s enjoyed the second highest rate of growth of all the teams from the capital, at 4.11%.

Crystal Palace vs. Brighton 

Crystal Palace has also enjoyed better growth than both Chelsea and Arsenal (3.46%), however, Brighton’s promotion revives one of the stranger footballing rivalries, and the Seagulls come out on top, with prices growing more than double that of Crystal Palace in the past year (7.12%).

Man United vs. Liverpool 

As already stated, although Man City is home to the cheaper average house price (£161,611) in the Manchester derby, United enjoys the higher rate of growth (8.58% to City’s 8.08%) – enough to also beat bitter rival Liverpool, where annual growth stands at just 3.55%.

South Coast 

Bournemouth and Southampton will face off in the Premier League again this season, having drawn in their last encounter. It’s a fairly close run where house price is concerned too, with Bournemouth edging it at 5.26%, to Southampton’s 4.18%.

But, despite their fall from footballing grace, it’s Southampton’s traditional rival Portsmouth that has enjoyed the best performance in property terms, with prices up by 7.40% in the last year.

Newcastle vs. Sunderland

There was no Tyne-Wear derby last season, after Newcastle’s relegation to the Championship the season before. But, despite the Magpies winning promotion back to the top flight, the Black Cats were woeful last season and, as a result, will be applying their trade in the Championship this coming season.

House price growth in the two areas mirrors their respective performances, with Newcastle seeing prices creep up by 1.39%, while Sunderland has seen values drop by 3.30% year-on-year.

Burnley vs. Blackburn

Despite their fall to League One, Blackburn is still on top of Premier League rival Burnley, with prices up by a huge 11.47% in the last year, to Burnley’s 8.57%.

Cardiff vs. Swansea 

Although a league separates the two in footballing terms, Cardiff outperforms Swansea in the Welsh derby for property price growth, with prices up by 5.80%, compared to 4.46% in Swansea.

Oxford vs. Swindon 

Again, one league currently separates old-time rivals Oxford and Swindon, and, despite a price tag of £414,659 – nearly double that of Swindon’s £210,052 – Oxford comes out on top in both football and property terms, with prices up by 6.40% annually, to Swindon’s 6.05%.

The Founder and CEO of eMoov.co.uk, Russell Quirk, comments on the alternative Premier League: “Although it’s unlikely the table will look like this at the end of the season, it does demonstrate that, while there are pockets of the UK currently seeing a decline in price growth, there are also areas all over the nation enjoying very healthy increases in values.

“It’s also interesting to see how rival areas are performing differently, particularly those in close proximity to each other. Although neighbours, Liverpool and Manchester are seeing different rates of growth, the higher-end London clubs have seen prices stall whilst the capital’s peripheral teams are doing well, and Newcastle and Sunderland are seeing opposite fortunes in price growth terms.”

How is your team’s property market performing?

ICA-JL-VOTE-FOR-US

Who Would Win Tomorrow’s World Cup Qualifier Based on the Property Market?

Published On: June 9, 2017 at 9:45 am

Author:

Categories: Property News

Tags: ,,,

While the General Election result may be dominating the news at the moment, some will be more concerned with tomorrow’s World Cup qualifier between England and Scotland.

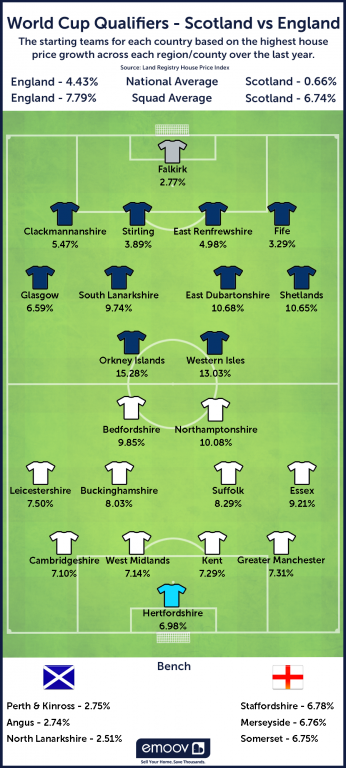
Ahead of the match, online estate agent eMoov.co.uk has formulated a team sheet based on each country’s property market performance over the past season.

The agent has assessed the percentage change in house prices across each county/region of England and Scotland over the last year, based on Land Registry data.

It then filled out each team with the 11 locations that have enjoyed the higher rate of price growth over the past 12 months, along with three substitutes.

The gap is narrow where the top 14 locations in the squad are concerned, with the average rise in the last year hitting 6.74% in Scotland – just -1.5% behind England.

On the pitch, Scotland’s team has seen a number of the largest increases across both countries, with the Orkney Islands (15.28%), Western Isles (13.03%), East Dunbartonshire (10.68%) and the Shetlands (10.65%) all having seen a larger rise than England’s best player, Northamptonshire (10.08%).

Although it may not be so close on the pitch tomorrow, at least Scotland’s property market seems to be shaking off the recurring uncertainty of its campaign for independence, which has left many homeowners in limbo on their property sales.

Take a look at the starting teams for each country in eMoov’s team sheet below:

Who Would Win Tomorrow's World Cup Qualifier Based on the Property Market?

Who Would Win Tomorrow’s World Cup Qualifier Based on the Property Market?

We will continue to keep you updated of all the happenings regarding the General Election on our website and social media. Remember to follow us on Twitter, Facebook, Google+ and LinkedIn for the latest updates!

Get involved to let us know what you think of the hung Parliament result and what you think will happen to the property market as a result – We love hearing from our landlords.

Who tops the Premier League table for rental yields?

Published On: May 26, 2017 at 10:12 am

Author:

Categories: Landlord News

Tags: ,,,

With the F.A Cup and Play Off finals set to bring the curtain down on another domestic football season, an interesting new-look Premier League table has been released.

The table, collated by North-East based sales and lettings firm KIS and deposit-free renting solution Dlighted, positions the 20 Premier League clubs on the strength of their local property market.

More specifically, the standings show positions if team were judged on average returns for buy-to-let let investors for two-bedroom properties in their local postcode area.

Mersey Pride

Merseyside took the title, with Everton pipping neighbours Liverpool to the crown by just 0.3%. Properties in L4 offer average returns to investors of 9%, in comparison to 8.7% in Anfield’s postcode region of L6.

The Champions League spots were taken by this years relegated sides Middlesbrough, Hull and Sunderland, where returns are 8.5% 7.1% and 7% respectively.

On the other hand, Premier League Champions Chelsea would be relegated in this table, alongside runners-up Tottenham and new Europa-League members Arsenal. Typical returns in these regions amount to 2.2%, 1.2% and 2.7%.

Manchester United survived the drop by the skin of their teeth, finishing 17th with yields of 3.8%.

Who tops the Premier League table for rental yields?

Who tops the Premier League table for rental yields?

North-East

Ajay Jagota, founder of Dlighted and KIS, observed: ‘It’s been a tough year for fans of the Premier League teams in our native North East and we’re glad that there’s at least one table where Sunderland and Middlesbrough are close to the top.’

“Even though this is all just a bit of fun and not a serious investment guide, we have inadvertently learned something very interesting about the state of the buy-to-let market in England and Wales.’

‘There is a theory in the industry that landlords are increasingly turning away from London and the South East and investing instead in other parts of the country. With no London club finishing higher than 14th and North East and North West clubs dominating the league, our table suggests that this could actually be a very wise move.’[1]

[1] http://www.propertyreporter.co.uk/property/everton-top-the-premier-league-of-renting.html

Where tops the table for house price growth near Premier League stadia?

Published On: September 30, 2016 at 10:44 am

Author:

Categories: Property News

Tags: ,,,,

They may have had a poor start to the Premier League season but Stoke tops the table for annual property prices increase for homes located near Premiership stadia.

Analysis from Purplebricks shows that homeowners living near the Britannia Stadium enjoyed a 22% rise in the value of their property.

Top of the league

Overall, the average price of property located near to Premier League grounds increased by 8.7% over the year-rising from £284,970 to £309,870. The average price of a home in the UK is currently £216,750.

In London, Spurs took the glory, with prices in Tottenham up by 12.1%. Chelsea came second in the capital, with prices in the region up by 10.9%. Arsenal recorded rises of 10.1%, with West Ham 9.4%.

The red half of Manchester took the plaudits, with property values up by 4.8% near Old Trafford. Prices near the Etihad Stadium saw a smaller, 2.4% increase.

Property prices near the home of Premier League champions Leicester City saw an annual rise of 7.5%. On the South Coast, near St Mary’s stadium Southampton, values rose by 7.7%.

Fighting relegation

Liverpool finds itself in the relegation zone, with prices 6.41% down year-on-year, due to the area around Anfield awaiting major redevelopment.

Land Registry figures for the last 15 years show that the price of property near Premier League venues have increased by 10% more than the national average.

You have to look no further than the Etihad Stadium, opened in 2002, for the impact a new stadium can have on property prices. Before the stadium was built, property in the area could be purchased for an average of just £20,378. Now, the average is £156,092, a monumental rise of 665%.

Prices around Anfield have seen a rise of 277% over the same period, while in Stoke, average values have risen by 215%.

Where tops the table for house price growth near Premier League stadia?

Where tops the table for house price growth near Premier League stadia?

Redevelopment

Michael Bruce, CEO of Purplebricks, said: ‘football stadiums generally used to be in run-down areas of a city, often cramped between back streets, whereas most are now sited in areas which have undergone major redevelopment and boast new transport links, attractive new amenities, shops and bars. This has been reflected in house prices, which are consistently higher than those in neighbouring locations.’[1]

‘Our data proves that living near to your favourite club makes good financial sense-and it’s also handy for home games too.’[1]

[1] http://www.propertyreporter.co.uk/property/premier-league-properties-see-game-changing-price-rise.html

eMoov Completes its Property-Based Euro 2016 Tournament

Published On: June 29, 2016 at 10:59 am

Author:

Categories: Property News

Tags: ,,,,

With the knockout stages of the Euro 2016 championship in full swing, online estate agent eMoov.co.uk has completed its property-based tournament to reveal the winner.

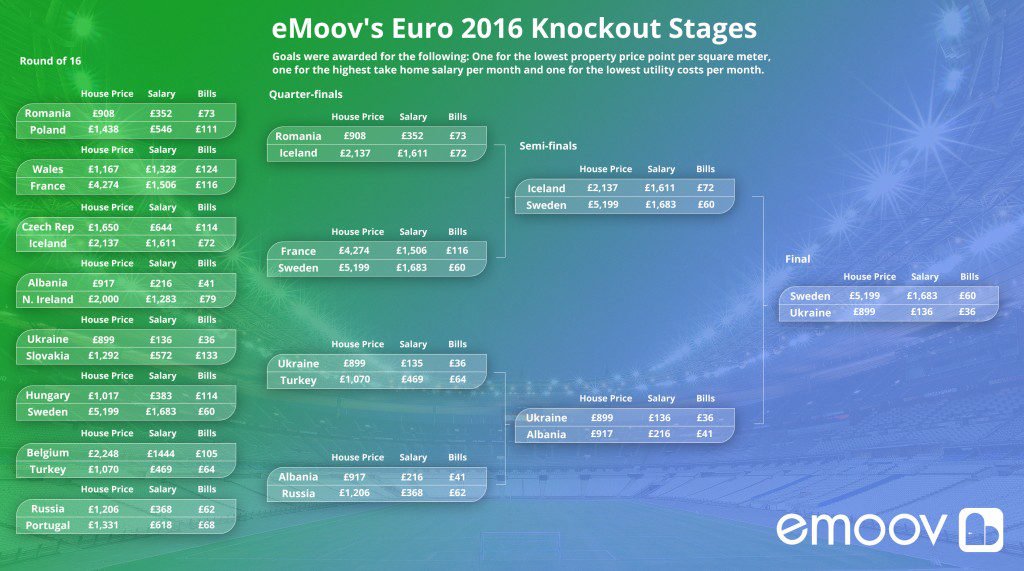
After previously comparing each team in the group stages – awarding goals for the highest take home salary, lowest property price per square metre, lowest monthly utilities costs and the lowest cost of a monthly gym membership – eMoov has moved onto the last 16 teams in its alternative, property competition.

In the knockout stages, eMoov has removed the criteria for lowest gym membership cost. Goals have been awarded on which country has the higher take home salary, the lower property price and the lower cost of utilities.

The last 16 

Although Poland has a higher take home salary, Romania took the first quarter-final spot with cheaper house prices and bills.

France beat Wales in a tight match to take the second quarter-final place. Although the cost of property per square metre is higher in France (£4,274) than Wales, the team did enough to secure the spot with a higher take home salary (£1,506) and marginally lower monthly bills (£116).

The Czech Republic lost out to one of the smallest nations in the tournament, Iceland, due to its lower take home salary and higher bills. However, the Czech Republic does offer a lower house price, securing them one goal.

eMoov Completes its Property-Based Euro 2016 Tournament

eMoov Completes its Property-Based Euro 2016 Tournament


Albania secured a quarter-final position over Northern Ireland. With a property price of just £917 per square metre and monthly bills of £41, compared to Northern Ireland’s £79, Albania moves onto the next round.

Despite a take home salary of just £136, Ukraine beat Slovakia with a house price of just £899 and a cost of utilities (£36) almost £100 cheaper than Slovakia.

Sweden started a goal down against Hungary, which has the lower property price. However, it rescued the game with a much higher salary (£1,683 to £383) and utility bills of around £54 cheaper.

Belgium lost out to Turkey due to its property prices being double its competitor’s, as well as a much higher cost of utilities – £105 to Turkey’s £64.

Finally, Russia secured the last quarter-final place against Portugal in one of the tightest games so far. Despite having a lower take home salary (£368) than Portugal (£618), Russia has the lower house prices (£1,206) and beats Portugal with lower utilities (£62).

The quarter-finals

In the first game, Iceland narrowly beat Romania. At £908 per square metre, Romania’s lower house prices put them one nil up. However, with a salary of just £352 to Iceland’s £1,611, the game was tied. With its utilities being just £1 cheaper, Iceland snatches the lead at the last minute.

Sweden came out on top of the host nation, France, with a higher take home salary and lower utility bills (£60), despite a property price (£5,199) of almost £1,000 per square metre more than France.

The Ukraine sent Turkey home with a lower house price and utilities, although Turkey was awarded a goal for a higher take home salary, of £469 – more than three times that of the Ukraine.

Albania knocked Russia out of the competition to secure a place in the semi-finals, beating it on both property prices and utility costs. Russia did manage a goal, however, thanks to its higher take home salary.

The semi-finals

Iceland just fell short of a place in the final, offering a considerably cheaper property price (£2,137) than Sweden, but having a lower take home salary and higher utility costs, giving Sweden a spot in the last game.

In the other semi-final match, Albania also fell short to the Ukraine. The Ukraine’s cheaper house prices and lower utility bills beat Albania’s higher take home salary.

The final

The Ukraine takes on Sweden. At £5,199, the price of property per square metre in Sweden is almost six times that in the Ukraine, giving the Ukrainians an early lead. However, Sweden levelled the game with a take home salary of £1,683 – £1,547 more than the Ukraine. But late into the game, Ukraine took the lead with utility costs of just £36 – £24 cheaper than Sweden’s.

The founder and CEO of eMoov, Russell Quirk, comments: “Forget Ronaldo, Gomez or Pogba, all you need to come out on top of the Euros is an affordable property price, good take home salary and low cost of living – something the Ukraine has across the board.

“Obviously, this knockout stage will look completely different to the world football powers that are likely to dominate the actual Euros, but it does offer a good insight into how countries across Europe match up when it comes to property price and the cost of living.

“What with the outcome of the Brexit vote, we could see masses of remain campaigners flee to remaining EU member states for sanctuary based solely on this research.”

England Wins Euro 2016… In Property Terms

Published On: June 27, 2016 at 10:55 am

Author:

Categories: Property News

Tags: ,,,,

It may not be the favourite team to win the Euro 2016 tournament, but England has won the league in property terms, based on research by TheMoveChannel.com.

The property portal has compared the property markets of the 24 competing countries across three categories: house price growth in the year to the first quarter (Q1) of 2016, using Knight Frank’s Global House Price Index; the number of properties listed for sale on the international site; and demand from investors, measured by the number of enquiries from buyers on TheMoveChannel.com in the 12 months to June 2016.

Combined, these three factors determine how healthy a country’s property market is.

Turkey top for house prices

Turkey came out on top for house prices in Europe. According to Knight Frank’s Global House Price Index, the country has experienced huge house price growth in the year to Q1 2016, of 15.2%, ahead of Sweden’s 12.9% and Austria’s 7.6%.

England Wins Euro 2016... In Property Terms

England Wins Euro 2016… In Property Terms

Turkey has seen the strongest house price growth in the world for the last three consecutive quarters, driven by the country’s rapidly growing population, ongoing infrastructure development and high demand.

Spain leads foreign investment 

Spain was named as the most popular destination in Europe for foreign buyers, attracting the highest number of enquiries on TheMoveChannel.com in the 12 months to 2016.

It is followed by investor favourites such as Portugal, France, Turkey and Italy. Italy was also the country with the most properties listed for sale as of June 2016, ahead of England, Spain, France and Portugal.

The quarter-finals 

TheMoveChannel.com followed the format of the Euros by determining the top performers of each group, before progressing through to the knockout stages of the tournament.

In the quarter-finals, Spain beat Switzerland with the sheer force of buyer demand. England won over Portugal due to stronger house price growth and a higher level of homes for sale. Turkey triumphed over Germany thanks to its unbeatable property price rises, while France flew past Austria with its lifestyle appeal.

Semi-finals

While Spain is the most popular spot in Europe for investors, England beat its neighbour with stronger house price growth (5.3% versus 2.4%) and a higher number of properties for sale.

Although France’s house price growth was low compared to Turkey’s (0.5% versus 15.3%), demand for French property is hard to match, thanks to its record low mortgage rates.

The final – England vs. France

England’s house prices have been accelerating for some time, thanks to a chronic lack of housing supply. In the 12 months to June, prices soared by 5.3% compared to France’s 0.5%. England also boasts more properties for sale, leading to a clear win. However, France did score a consolation goal thanks to a higher level of buyer interest.