UK property prices set to rise by 50% in next 10 years
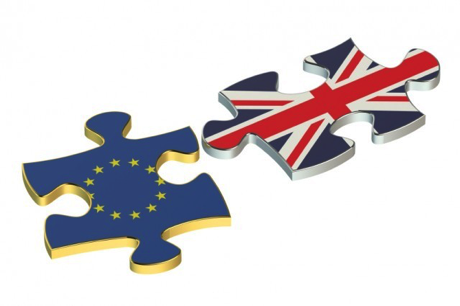
Interesting new research has revealed that Britain’s property market is set to be resilient in the face of ongoing Brexit uncertainty.
The investigation conducted by eMoov suggests that property prices are set to rise by over 50% during the next 10 years.
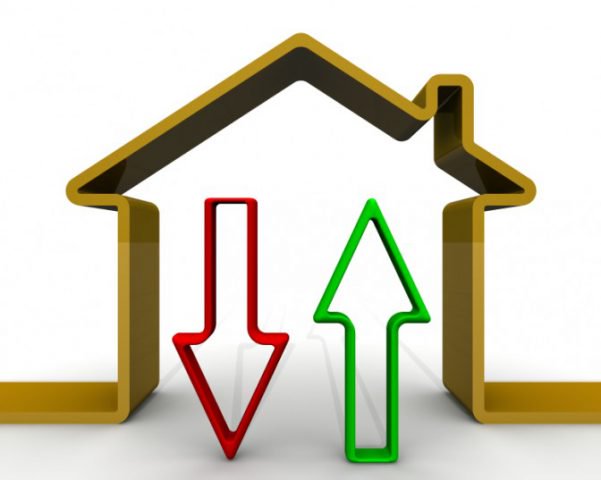
Price Rises
Analysis from eMoov suggests that UK house prices have risen by 0.37% per month on average since the EU referendum, in comparison to 0.67% per month on average between June 2015 and 2016.
Data from the report indicates that if values carry on rising at 0.37% per month, the average UK house price would still reach £34,757 in the next decade. This is a rise of 56%.
Using data from the Land Registry, the firm applied the present rate of growth to the current average house price up until 2027 in order to assess the new data.
It then calculated the total percentage difference between the current and future average house price in order to rank each city on the highest overall growth rate.
Nottingham comes out on top for price growth since the Brexit vote, with prices rising by 0.8% per month on average. If this was to continue, the average house price would increase 160% from £133,215 to £346,592 by 2027. Glasgow has seen values increase by 0.7% a month since the start of June last year, which was the second highest.
Oxford and Cardiff have also seen strong price rises since the Brexit vote.
UK property prices set to rise by 50% in next 10 years
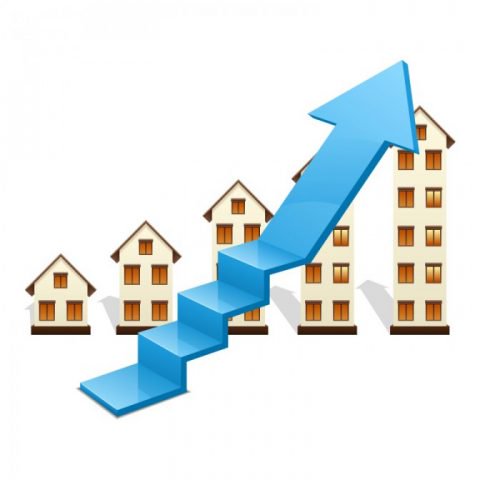
Growth
Even those cities that have seen the smallest house price growth since the EU referendum vote would still see decent increases. Newcastle, where prices have risen by an average of just 0.07% on average each month since June 2016, would see the current average of £156,753 rise by £13,731 to £170,485 in the next 10 years.
Russell Quirk, Chief Executive Officer of eMoov, observed: ‘With latest industry figures indicating an end to the post-Brexit market slowdown that has seemingly plagued the market over the last 18 months, many UK home owners will be breathing a sigh of relief, despite having still enjoyed a notable annual increase in their property’s value.’
‘Although these recent slower rates of price growth are unlikely to persist going forward, and we are by no means predicting they will, this research demonstrates that the outlook would still be rather positive and far from the apocalyptic prophecy’s many have talked the market down with since the Brexit vote.’[1]
[1] http://www.propertywire.com/news/uk/brexit-brexit-british-house-prices-set-rise-50-next-decade/