Posts with tag: property prices

The Most Expensive and Cheapest Road Names in the UK

Published On: January 31, 2016 at 4:47 pm

Author:

Categories: Property News

Tags: ,,

Ever wondered where the most valuable homes are found? On roads with the word Warren in their name apparently!

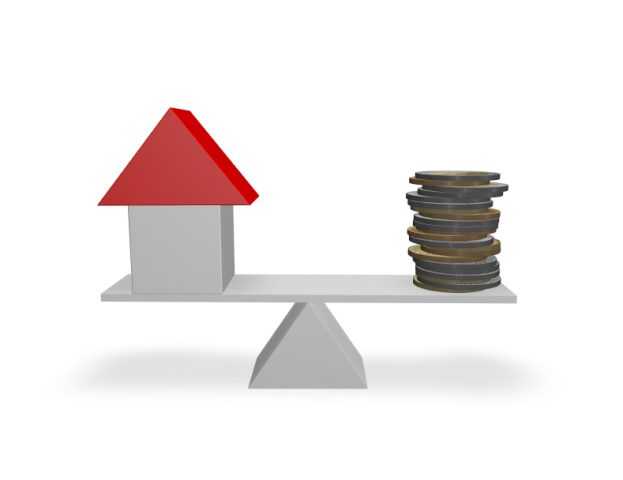
These properties cost an average of £607,267 – more than double the typical house price in the UK of £282,978, according to Zoopla.

The Most Expensive and Cheapest Road Names in the UK

The Most Expensive and Cheapest Road Names in the UK

Other pricey homes can be found on roads including the words King, Queen, Prince or Princess.

Zoopla has analysed more than 28m properties in the UK to find the most expensive and cheapest road names.

The cheapest properties have Street in their address and are worth an average of £184,722, followed by homes on roads with Court or Terrace in their name.

The majority of homes – around 2.1m – have the word Road in their address, while more than one million properties are in roads with Street in their name.

The property portal’s Lawrence Hall comments: “The saying goes that the three most important factors in buying a house are location, location, location; our research shows that even the road name you choose can make a difference to how much you can expect to pay when finding a property.”1

Here are the most expensive and the cheapest property prices, based on road name:

  1. Warren – £607,267
  2. Chase – £482,867
  3. Mount – £390,500
  4. Path – £389,732
  5. Park – £384,809
  6. End – £381,933
  7. Green – £363,348
  8. Way – £358,981
  9. Hill – £354,301
  10. Lane – £342,059
  11. Gardens – £340,461
  12. Paddock – £320,984
  13. Walk – £319,926
  14. Rise – £307,965
  15. Lawns – £302,760
  16. Place – £293,403
  17. Road – £292,403
  18. Grove – £289,385
  19. Drive – £286,098
  20. Parade – £275,766
  21. Square – £272,614
  22. Nook – £270,511
  23. Close – £268,957
  24. Crescent – £265,055
  25. Pastures – £262,060
  26. Avenue – £261,850
  27. Meadows – £252,000
  28. Row – £233,778
  29. View – £207,641
  30. Terrace – £194,403
  31. Court – £194,172
  32. Street – £184,722

1 http://www.independent.co.uk/property/house-and-home/property/the-uks-most-expensive-and-cheapest-road-names-revealed-a6836771.html

Britain’s top house price performers in 2015 revealed

Published On: December 29, 2015 at 12:19 pm

Author:

Categories: Property News

Tags: ,,

As the year draws to a close, the Halifax has presented a rundown of Britain’s top house price performers during 2015.

Research from the firm has revealed that Newham in London recorded the largest percentage rise in property price values in major UK towns and cities during the past year.

Ups

The Halifax’s own house price data reveals that the average house price in Newham was 22% greater than in the last year. Property prices rose from £261,399 to £319,522 in 2015. This represents almost double the 12% that London recorded as a whole.

Royston in Hertfordshire saw the second highest rise in average house prices, with an increase of 19%.

Unsurprisingly, the top-ten performers were all in London and in the South East.

Outside of these areas, Stroud in Gloucestershire, Wellingborough in Northamptonshire and Solihul in the West Midlands were the regions with the largest growth. All recorded price increases of between 14-15%.

Britain's top house price performers in 2015 revealed

Britain’s top house price performers in 2015 revealed

Downs

Just a few towns recorded a decline in house price values during the last year. The greatest was in Merthyr Tydfil, South Wales where prices slumped by 3.8%. Colwyn Bay saw prices dip by 2.3%, Durham 2.1% and Coalville 0.5%.

The top-ten worst performers were all located outside of London and the South East, with the exception of Kensington and Chelsea, where prices rose by just 1% during 2015.

‘Those areas that have seen the biggest house price increases over the past year are either in outer London or within close commuting distance of the capital,’ noted Martin Ellis, housing economist at the Halifax. ‘Demand in these areas has risen as rapid house price rises in central London in the past few years have caused increasing numbers of people to look for property in more affordable areas.’ [1]

‘A few towns have experienced modest price falls,’ he continued, before stating that, ‘these areas are typically stiff suffering from relatively weak employment and economic conditions, which has dampened local housing demand.’[1]

[1] http://www.propertyreporter.co.uk/property/where-is-the-uks-top-house-price-performer-in-2015.html


Are Rents Really as Expensive as Claimed?

Published On: December 22, 2015 at 2:05 pm

Author:

Categories: Finance News

Tags: ,,,

Are Rents Really as Expensive as Claimed?

Are Rents Really as Expensive as Claimed?

The news is full of how renting is extortionate and landlords exploit tenants… But is this actually true? Just how expensive is renting?

Recently, rents have performed strongly year-on-year, in line with earnings growth – almost for the first time since the start of the recession.

Rent price indices from LSL Property Services and Belvoir use advertised rents, showing the highest increases, while Countrywide studies prices for existing tenants, which although indicate growth, show rents rising at a much slower rate than for those new to the market.

This data shows that landlords do not exploit tenants with huge increases and reflects the true movements of the rental market.

Regionally, the Office for National Statistics (ONS) found that property prices range massively – from an average of £158,000 in the North East to 3.36 times that in London, at £531,000.

The lowest average rent is in the East Midlands, at £609 per month, with the typical rent in the capital set at £1,442 a month – just over double. This indicates that rents do not rise at the same rate as house prices. And although there have been some high increases, 8-10% annually, these are predominantly for newly advertised rental homes.

Countrywide found that for existing tenants (the majority), rent prices hardly rise at all.

Rent price growth should also be put into context. Since the recession, private sector rents dropped by between 5% in London and 20% in Nottingham. Since then, many increases have been reported as rises, but were simply recoveries. While rents in the East Midlands have grown by 6-8% yearly, today’s prices are only just back to levels recorded in 2008.

Ideally, rents should rise in line with inflation, meaning that landlords have, in fact, seen a price cut over the years.

How have your rent prices changed over the last few years? And do you believe this is correct?

Rightmove Reports Strongest December for Nine Years

Published On: December 14, 2015 at 1:41 pm

Author:

Categories: Property News

Tags: ,,,,,

This month has been the strongest December for the housing market since 2006, according to Rightmove’s latest data.

Rightmove Reports Strongest December for Nine Years

Rightmove Reports Strongest December for Nine Years

The property portal expects to see further rises in property prices next year, as the International Monetary Fund (IMF) warns that increasing house prices are posing a threat to the UK economy.

However, property expert Henry Pryor believes that we could be witnessing the height of the market at present. He tweeted: “When they ask you ‘How did you know the market had peaked?’ say ‘2 beds in SW8 for £3.15m’.”

Pryor was referring to a two-bedroom apartment in Nine Elms, Battersea that has been put up for sale for £3.15m.

Rightmove has reported the lowest December drop in asking prices for new homes on the market in nine years, with a monthly decline of 1.1%. Annual house price growth is now 7.4%.

It found that buyer inquiries to agents since the start of October were up 37%, while the amount of properties coming onto the market has fallen by 5% compared to the same period last year.

The portal’s average new asking price is £289,452 and it expects this to rise by 6% next year.

Director and Housing Market Analyst at Rightmove, Miles Shipside, comments: “Whilst a fall in new asking prices is the norm at this time of year, this is December’s best post-financial crash performance, signalling another round of price rises in 2016.

“Despite the shortage of suitable stock in many parts of the market, demand for housing is on the up.

“Although the average price of property coming to market is already up by a hefty 7.4% compared to a year ago, Rightmove forecasts that prices will reach and breach new records next year.”

On the extra Stamp Duty costs for buy-to-let properties and second homes – coming into force from 1st April – Shipside says: “Those looking to expand their property portfolios will be trying hard to find suitable properties to buy and then complete the purchase before the April deadline.

“Those selling for the first time are likely owners of properties suitable for renting out, so they may be best advised to take advantage of any surge in investor activity and market as soon as possible.

“Given that the legal process could take six weeks or so once a buyer is found, they only have between now and the middle of February to take advantage of this artificially-induced boost to buyer demand.”1

1 http://www.propertyindustryeye.com/this-is-the-strongest-december-for-nine-years-says-rightmove/

House prices to rise by 7% after Stamp Duty rise?

Published On: December 9, 2015 at 2:00 pm

Author:

Categories: Property News

Tags: ,,,

Economists have today warned that buy-to-let lenders seek to avoid paying additional stamp duty from next April could be the catalyst for a 7% rise in UK house prices.

This warning comes despite a fall in property prices during November.

Rises

IHS Global Insight said that it expects a substantial rise in the price of housing in the coming months. The group forecasts increases of between 6% and 7% during 2016.

The Chancellor shocked the industry by announcing the 3% stamp duty hike on buy-to-let and second homes during last month’s Autumn Statement. IHS feel that these changes, ‘could lead to an increase in housing demand and exert upward pressure on prices as prospective buyers look to beat the increase’ in the short term.[1]

House prices to rise by 7% after Stamp Duty rise?

House prices to rise by 7% after Stamp Duty rise?

However, the Halifax reported that property values actually slipped by 0.2% between October and November. This said, prices in the three months to the end of November were 9% higher than at the same time in 2014.

Average property prices last month totalled £204,552.

Martin Ellis, Halifax housing economist, commented, ‘the increasingly acute imbalance between supply and demand is causing prices to rise at a robust pace.’[]

[1] http://www.standard.co.uk/business/house-prices-could-rise-7-thanks-to-stamp-duty-hike-a3132451.html


Rent growth slows to pace of house price rises

Published On: October 19, 2015 at 1:01 pm

Author:

Categories: Finance News

Tags: ,,

This follows nine consecutive months of accelerated growth.

Increases

The report shows that rent prices are now 8.5% greater than one year ago for the three months to September 2015, following six months of annual growth over 10%.[1]

Average rent for new tenancies in Britain over the period was £995 per month. However in Greater London, this figure rose to £1,555 per months, despite monthly rents dropping for the first time since February 2015.

Data from the Index suggests that deflation across the economy, alongside rising incomes, means that the drop in rents could be a temporary occurrence.

Regional rises

Figures from the report show that nine out of twelve UK regions are experiencing rent price rises on an annual basis. The largest increases were seen in Scotland (8.4%), the East Midlands (7.7%) and Greater London (6.6%).[1]

Three regions are in negative annual price movement, with prices in the North West down by 4.6%, East Anglia 2.2% and Northern Ireland 1.4%.[1]

When comparing September’s figures to those in the previous month, the Index shows that just three regions have sent rental increases since August. In the three months to September, only Scotland (1.2%) and the East and West Midlands (1.4%) have seen price increases.[1]

Rent growth slows to pace of house price rises

Rent growth slows to pace of house price rises

Falls

All other regions saw a modest dip in rents in the same period. The largest falls were seen in South West (2.4%), the North East (2.3%) and the North West (2.2%) respectively.[1]

Martin Totty, chief executive of Barbon Insurance Group, owners of HomeLet, stated that, ‘the UK economy has dipped into negative inflation which is a boost to consumers’ spending power and ultimately, their real income. Affordability is an important factor in determining rents.’[1]

‘Depending on what happens with inflation and real incomes over the coming months, this could have a bearing on future rental price trends especially where, in certain areas of the country, the supply of rental properties is not keeping pace with demand from those wishing to be private sector renters,’ Totty concluded.[1]

[1] http://www.propertywire.com/news/europe/uk-rental-prices-index-2015101911106.html