Posts with tag: property prices

How Long do House Prices Drop For?

Published On: July 3, 2015 at 1:03 pm

Author:

Categories: Finance News

Tags: ,,,

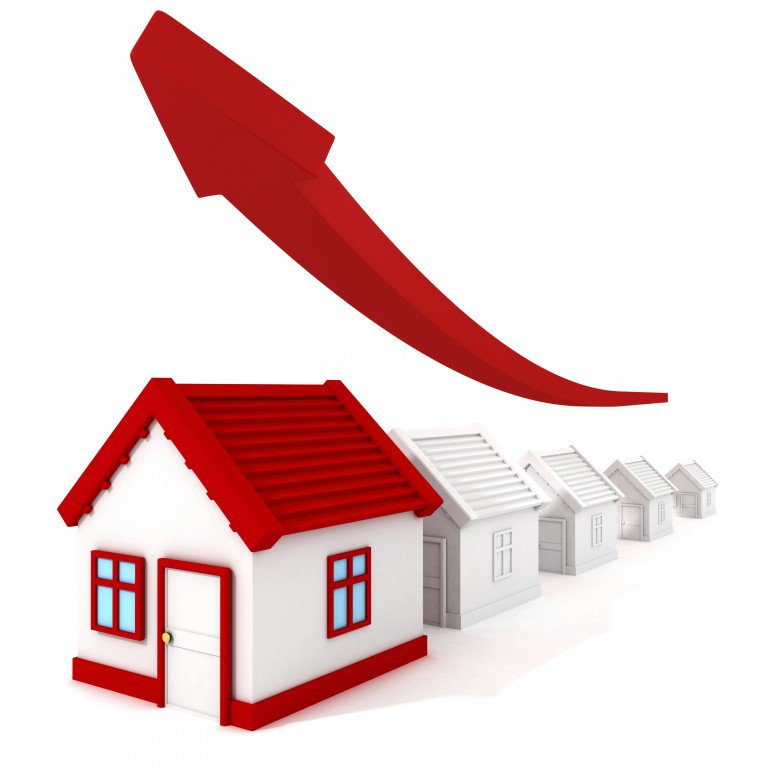
In 2007 and 2008, the country suffered a severe house price crash. In 2010, some areas saw prices bounce back slightly.

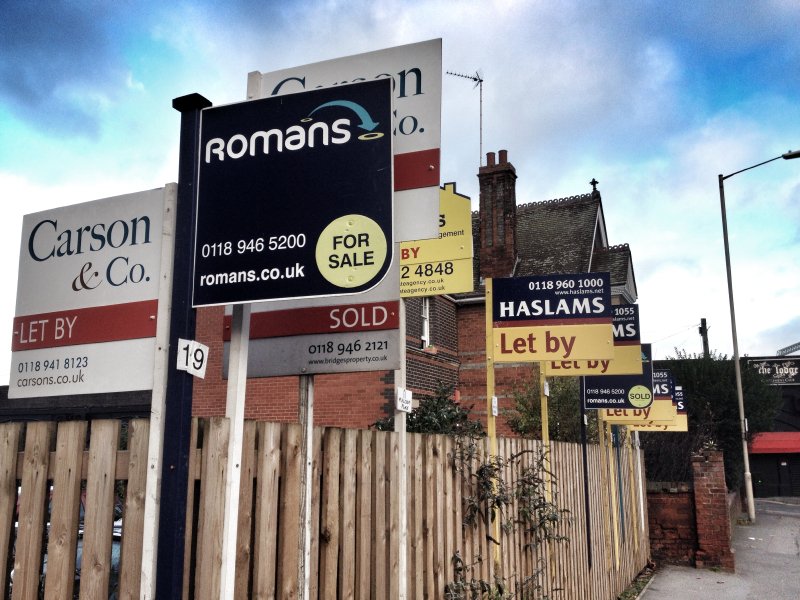
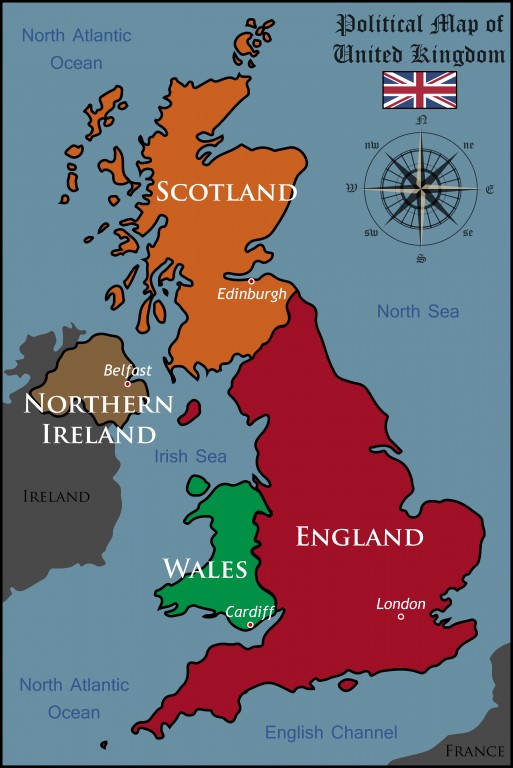
After this period, where your property was in the UK greatly affected its price.

Some places experienced continuous price growth from 2010 onwards and they are still rising now.

In some parts, prices became stagnant, and then began to increase in 2013 and 2014. In Brighton and Hove, the average house price is now above 2007-08 levels, while other areas have recovered but are still lower than they were before the crash.

In places like Liverpool and Bradford, the average property price is still almost 30% lower than they were eight years ago.

How Long do House Prices Drop For?

How Long do House Prices Drop For?

When house prices drop significantly, it usually means there is an economic recession. For homeowners, this can be devastating, as the value of their biggest asset is falling and they may also face employment issues.

During these periods, newspaper headlines do not help. The Guardian said: “House prices set to fall by further 12% in 2009”1, while the BBC reported: “House prices ‘fell 15.9% in 2008’.”1

These statements influence buyers and vendors. If the newspaper says prices are falling, house hunters will delay buying, which can then cause prices to decline further, as desperate sellers cut their prices until they sell.

It is difficult to determine how long prices will drop for, but it is possible to look at past trends.

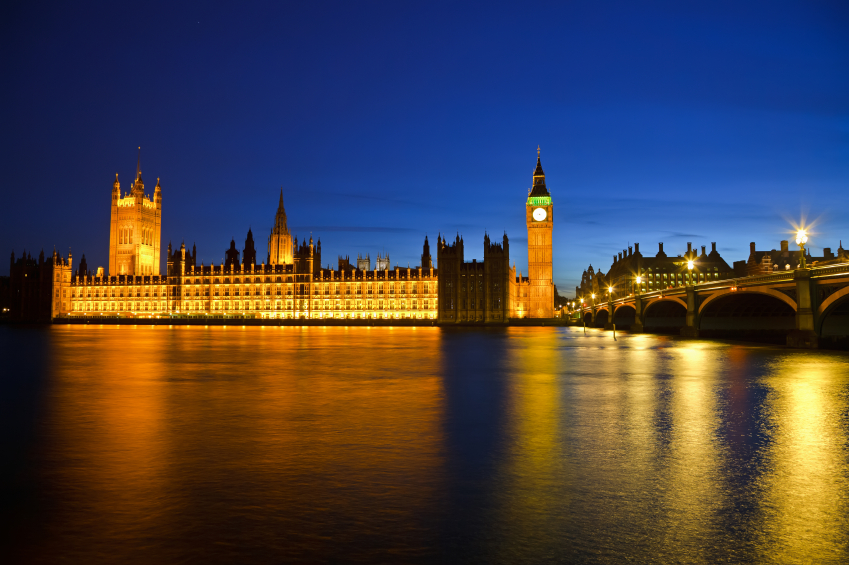
Property expert Kate Faulkner has analysed this data for each of the 32 London boroughs.

Property prices decreased for 18-20 months by 16-18% in the following boroughs: Havering, Hillingdon, Brent and Lambeth.

Most boroughs’ (23) prices fell for 13-17 months. These boroughs saw drops for 17: Barnet, Redbridge, Merton, Southwark and Waltham Forest.

The boroughs that declined for just 13 months were: Hackney, Ealing, Haringey, Richmond upon Thames and Wandsworth.

In terms of the greatest drops, Newham and Barking and Dagenham experienced decreases of 22%, while Hackney, usually one of the capital’s best performing boroughs, saw drops of 21%.

Those falling by less include the City of Westminster at 14% and Southwark, Haringey and Ealing at 16%.

The following boroughs experienced price declines for the shortest period, of just 12 months, with 19-20% reductions: Hounslow, Tower Hamlets and Kingston upon Thames.

The boroughs of Kensington and Chelsea and Camden dropped for only eight and nine months respectively, by 16-17% – also some of the smallest falls.

Analysing these London figures, property prices generally drop for 8-20 months, with the average at just over a year.

If you have an idea of how long prices will decrease for, vendors can plan whether to continue trying to sell or rent out the property until the market has recovered.

Home movers, investors and first time buyers will also benefit from knowing how long property prices will fall for, however, it is never really clear when the bottom has been hit until some time afterwards.

Knowing the length of time prices decline for in a certain area gives an indication of what to look for and also proves that prices won’t drop forever, as some people predicted during the crash.

1 http://www.propertychecklists.co.uk/articles/property-prices-rise-fall


Average House Price Rose 1.4% in May

Published On: June 30, 2015 at 9:34 am

Author:

Categories: Landlord News

Tags: ,,,

The average property price in the UK rose 5.6% annually and 1.4% monthly in May, making the average house price £212,495, revealed the latest data from haart estate agents.

In London, the market is gaining momentum again after uncertainty surrounding the general election. Prices are up 16.7% year-on-year and 3.4% on a monthly basis, to an average of £536,286.

Average House Price Rose 1.4% in May

Average House Price Rose 1.4% in May

The capital has also experienced an upsurge in sales, recording the highest monthly rise since August 2014. The monthly data report from haart also found that in May, there were 11 potential buyers for every available property around the country. In London, this is 20 per home.

These figures indicate a slight fall in activity both annually and monthly. However, it is clear that the market is still busy and consumer confidence is high.

Overall research from haart reveals a steady increase in house prices since November 2014, which has been fuelled by high levels of demand and low supply.

The average first time buyer property price is also on the up, rising 4.3% annually and 1.7% month-on-month. The amount of new buyers registering has risen slightly, up by 0.3% since April.

However, on an annual basis, the number of new buyer registrations is down 12.7%. The estate agent says that this was expected after particularly high levels of buyer activity in 2014. First time buyer registrations also dropped during the same period.

The amount of new properties coming onto the market has grown by 2.6% monthly and haart says that this indicates that vendors are confident in putting their house up for sale.

The average loan granted to a first time buyer has risen 4.2% yearly to just under £130,000. This reflects high institutional confidence in lending.

haart’s data also revealed that North London is the most expensive postcode area, with prices up 36% annually to an average of £667,944. The North West is the only area of the capital where the average home is still under £400,000.

CEO of haart, Paul Smith, says that will all the current market optimism and low mortgage rates, more people will aspire to buying. However, due to the lack of supply, property will become more unaffordable for many.

He continues: “First time buyer activity in London is down significantly, with 30% fewer first time buyer registrations in May 2015 compared to May 2014. The result will be that young professionals are driven from key areas, as they can’t afford to live there.

“This is bad news for local economies and the UK as a whole, and we need at least 200,000 homes built every year across the next Parliament to keep the housing supply crisis under control.”1 

1 http://www.propertywire.com/news/europe/uk-national-house-prices-2015062910682.html

How Much Has Your Property Price Changed in the Last Decade?

Published On: June 29, 2015 at 5:53 pm

Author:

Categories: Property News

Tags: ,,,

Residential property prices in Kensington and Chelsea have increased by 88% in the last ten years, representing the fastest price growth of any part of the country.

How Much Has Your Property Price Changed in the Last Decade?

How Much Has Your Property Price Changed in the Last Decade?

Contrastingly, house prices in Durham dropped 41% in the same period, a new map by estate agent Savills has found.

International investors’ attraction to London alongside high demand and 23% job growth in the past three years has pushed prices to new highs, far above the peak of 2007.

However, in most parts of the UK, property values are still below the record highs observed in the last boom, indicating a slow economic recovery for some northern towns.

Data from the Land Registry reveals that house price growth in England and Wales slowed in May, with no average price rises in the month.

The average price in May was £179,696, close to April’s £179,817 and just above March’s £178,007. The annual growth rate was 4.6% in England and Wales, the lowest rate for 15 months.

Despite London’s stalling market in the last six months, the capital still boasts the strongest annual price growth of any region.

Chief Economist at IHS Global Insight, Howard Archer, comments: “We suspect that housing market activity will continue to improve amid generally supportive fundamentals and reduced uncertainty following the general election.

“Meanwhile, a shortage of properties coming onto the market is currently exerting increasing upward pressure on house prices.

“Nevertheless, the upside for housing market activity and prices is expected to be constrained by more stretched house prices-to-earnings ratios, tighter checking of prospective mortgage borrowers by lenders and the likelihood that interest rates will start rising gradually from the first quarter of 2016.”1 

Use Savills map to work out how much the average house price has increased in the last ten years where you live: https://savills.cartodb.com/viz/f7961954-a7b2-11e4-90c2-0e4fddd5de28/public_map

1 http://www.telegraph.co.uk/finance/property/11700282/Mapped-How-much-has-your-house-price-moved-in-10-years.html

House price boost for Eastern England

Published On: June 29, 2015 at 9:42 am

Author:

Categories: Property News

Tags: ,,

House price increases in the East of England have come at almost the same level as those in the South East, according to the latest figures from the Land Registry.

According to the figures, property prices in the East rose by 8.8% in the twelve months to May, in comparison to 9.1% recorded in London and the South East. However, the annual rate of increase in England as a whole slowed to 4.6% in the same period.[1]

Growth

Guy Meacock, of buying agency Prime Purchase, commented that, ‘London has gone through a period of stratospheric growth, which was always going to be unsustainable at the same rate.’ [1]

Mr Meacock went on to say that, ‘the regional breakdown shows some areas are significantly outperforming others, but these markets are cyclical-that is a normal market with good and bad periods.’[1]

House price boost for Eastern England

House price boost for Eastern England

Steady

Taking England and Wales as a whole, property prices were mostly unchanged in May in comparison to April. However, the East and North East of England saw price hikes of 1.6% over the year, which was the largest increase in the country. However, prices in Wales fell by 1.7% over the same period.[1]

Experts predict that prices will increase during the summer months.

[1] http://www.bbc.co.uk/news/business-33286360


Southern house prices rise sharply

Published On: June 26, 2015 at 3:31 pm

Author:

Categories: Property News

Tags: ,,

New research from residential property analyst Hometrack indicates that UK house prices have increased significantly over the last 12 months. In particular, prices in the south of England have risen sharply.

Increases

On average, property prices in the UK have risen by £11,500 in the last year, meaning the average house price in a city is £189,400. However, property prices in London average out at £425,700.[1]

Data from the report also shows that month on month prices rose by 0.8%.

Southern soaring

Of all cities, Oxford recorded the largest rise during the last year, with prices rising by £41,700. This was followed by London at £38,900, Cambridge with £23,900, Bristol at £22,400 and Bournemouth at £15,300.[1]

The smallest price rises were recorded in the north of the UK. In Liverpool, prices rose by £4,200, in Newcastle, average increases totalled £4,700 and in Sheffield £5,300. In general, prices in the north are struggling due to less demand from house buyers.[1]

With this said, all cities, with the exception of Aberdeen, recorded on month on month price rises. Bristol had the strongest monthly rise of 1.3%, with Leicester, Liverpool and Belfast close behind with 1.2%.[1]

Southern house prices rise sharply

Southern house prices rise sharply

Improving

‘House prices have picked up momentum post-election,’ notes Richard Donnell, director of research at Hometrack. ‘An increasing proportion of households are feeling the benefits of the improving economy, which means that house price growth is set to continue in the coming months. The greatest risk is an earlier than expected increase in interest rates which would knock market sentiment,’ he continued.[1]

Donnell went on to say, ‘the strong demand side recovery seen in southern England has yet to spread to other cities revealing the diverse nature of the housing market. All cities are making gains at different rates of growth, but the cities with the biggest increases all have something in common  and that is strong local economies.’[1]

‘London has the highest price to earnings ratio, but it covers a wide range of sub-markets. Over the last three years, the impetus for house price growth has shifted from prime markets to the more affordable markets in outer London and the commuter belt,’ Mr Donnell added.[1)

[1] http://www.propertywire.com/news/europe/uk-cities-house-prices-2015062610674.html


Average prices in England and Wales revealed

Published On: June 25, 2015 at 3:16 pm

Author:

Categories: Property News

Tags: ,,

Research from the Office of National Statistics has revealed the highest and lowest average property prices across England and Wales.

Data shows that Blaenau Gwent in Wales has the lowest median house price, at just £75,000. This was in high contrast to the other end of the scale, namely the London Borough of Kensington and Chelsea, where average prices are a cool £1.19million.

Prices

The findings of the report also indicate that there was a noticeable north/south divide in property prices in England. In the main, this was due to prices in London surging by 32% over the twelve months, with all regions where property prices increased by over 20% located in the capital.[1]

Additionally, the figures look at home values by council area. They show that the local authority with the greatest increase in average house prices between 2013 and 2014 was South Buckinghamshire, where prices rose by 23%. The largest decrease was evident in the Isles of Scilly, where prices fell by 15% from £275,000 to £235,000.[1]

Average prices in England and Wales revealed

Average prices in England and Wales revealed

Parliamentary prices

When data concerning houses in Parliamentary constituencies is analysed, Walthamstow in north east London saw the greatest growth in the past year, up by 32%. Values in the borough of Hammersmith also rose considerably, from £456,000 to £570,000 on average, an increase of 25%.[1]

Westminster, Dulwich, Tottenham, Lewisham, Chelsea and Islington also made the top-ten. The only area outside of the capital and its surrounding regions to make the top 25 constituencies for price increases was Nottingham East.

Bradford West saw the largest slump in the entire country, with prices here dropping by 23%. Blydon and Rotherham also recorded more gentle property price value drops of 5%.[1]

[1] http://www.propertywire.com/news/europe/england-wales-house-prices-2015062510670.html