Posts with tag: homebuyers

Supply of Homes for Sale at Lowest Level since Records Began

Published On: April 27, 2017 at 9:47 am

Author:

Categories: Property News

Tags: ,,,,,

The supply of homes for sale in March was at the lowest level for the month since records began, shows the March Housing Report from NAEA Propertymark.

Supply of homes for sale 

The number of homes for sale on estate agents’ books dropped to an average of 39 in March, from 44 in February.

This is the lowest figure recorded for March since records began 16 years ago, in September 2002.

Supply of Homes for Sale at Lowest Level since Records Began

Supply of Homes for Sale at Lowest Level since Records Began

Annually, the supply of homes for sale dropped by 28%, as agents had an average of 54 properties on their books last March.

Demand for properties

The number of homebuyers registered per NAEA member branch dropped in March as well. Estate agents had an average of 397 prospective buyers on their books last month, compared with 425 in February.

In March last year, there were 417 prospective buyers registered per branch, marking a 5% year-on-year decrease.

Sales to first time buyers 

The proportion of sales agreed to first time buyers increased to 25% in March, up from 22% in February.

The total number of sales to first time buyers dropped significantly from 30% in January to 22% in February, so this increase is a step in the right direction, notes NAEA Propertymark.

Sales agreed

The average number of sales agreed dropped in March, to ten per branch. In February, 11 sales were agreed per branch – the highest number recorded since September 2007.

In March, one in every 20 (5%) properties sold achieved more than the original asking price. This figure has continued to rise since the low of 12% recorded in November 2016.

Stamp Duty reforms

A year on since the higher rates of Stamp Duty for additional properties were introduced, two thirds (64%) of estate agents have seen demand from buy-to-let investors drop.

Just under two fifths (37%) of agents have seen house prices rise as a direct result of the Stamp Duty reforms.

The Chief Executive of NAEA Propertymark, Mark Hayward, comments: “There are currently ten house-hunters chasing each available property, and with supply at the lowest level for March since records began, building more homes to satisfy demand needs to be a priority.

“In line with this, while sales to first time buyers rose slightly in March, they’re still much lower than the levels seen in the last three months of 2016, which is cause for concern. The upcoming General Election is a good opportunity for each party to outline their plans for tackling the housing crisis – we hope to see it prioritised so we can make the market a better place once and for all.”

eMoov Releases National Hotspots Index for Q1 2017

Published On: April 25, 2017 at 9:47 am

Author:

Categories: Property News

Tags: ,,,

Online estate agent eMoov.co.uk has released its National Hotspots Index for the first quarter (Q1) of 2017, looking at which areas of the UK have seen the largest and lowest spikes in property demand, as well as the greatest fluctuations on a quarterly basis.

The National Hotspots Index looks at the balance between supply and demand for housing stock in the UK’s 150 most populated towns and cities, giving each area a percentage score based on the level of stock available on the major property portals compared to that which has already sold.

Property demand across the UK stood at 33.80% in Q1 2017, having dropped by 17.56% since Q4 2016. The highest level of property demand in the UK was found in England, at 39.34%, with Scotland also higher than the UK average, at 36.18%. Meanwhile, Wales sat marginally below the UK average, at 27.35%.

The Founder and CEO of eMoov, Russell Quirk, comments on the National Hotspots Index: “A tough year for the UK market, due to a contribution 
of Brexit uncertainty and a hike in second home Stamp Duty tax, has seen buyer demand fall off during the start of 2017. Despite this reduction, the market has continued to tick over, with prices – for the large part – continuing their upward trend.”

The highest levels of buyer demand across the UK’s 150 most populated towns and cities in Q1 2017 were found in Rugby, 68.29%, Portsmouth, 66.70%, and Bristol, 64.43%.

The City of Aberdeen, 14.11%, once again recorded the lowest levels of demand, with Hartlepool, 15.43%, and Middlesbrough, 19.15%, also seeing low levels of interest.

Stoke-on-Trent (+82.25%), Stockton-on-Tees (+77.75%) and Walsall (+65.09%) have all seen the largest increases in buyer demand in Q1.

However, the popularity seen last year across London’s commuter hubs seems to have subsided, as Guildford (-35.84%), Watford (-35.73%), Cambridge (-29.74%), Reading (-27.17%) and Brentwood (-26.93%) all experiencing the largest declines in property demand.
eMoov Releases National Hotspots Index for Q1 2017

eMoov Releases National Hotspots Index for Q1 2017

Quirk says: “With many of the UK’s major cities becoming too expensive for homeowners in the region, and travel infrastructure improvements allowing us to live further away from work, it is no surprise that places such as Rugby and Portsmouth have grown in prominence amongst UK buyers. It isn’t just those in London that are looking outside of the larger city boundaries and opting for more affordable towns in the surrounding area.”

London

At 32.31%, buyer demand across the capital has been dampened, falling by 5% on Q4 2016. A tough year for London, coupled with continued levels of Brexit uncertainty, means that the capital places just 121st out of the 150 towns and cities for buyer demand.

Across London’s 32 boroughs, it is Bexley once again that retains the top spot as the hottest borough for buyer demand, at 56.13%. The borough has remained one of the strongest where interest from aspirational buyers is concerned, largely due to its peripheral location, more affordable house prices, and abundance of second and third rung property types.

The Olympic regeneration of Newham continues to draw buyers to the borough, with demand at 51.82%, while Havering is the third most in demand borough, at 50.51%.

Newham’s new found popularity is clear, as it is just one of two London boroughs to have not seen demand drop over the course of 2017. Since Q4 2016, the borough has seen buyer demand rise by a further 26.40%, joined by Harrow, where demand is up by 7.17%.

The worst decreases in the capital were in Greenwich (-60.83%), Lambeth (-57.62%) and Hounslow (-52.69%).

Prime central London

Nowhere in the capital was worse affected by the changes to second home Stamp Duty and the Brexit vote than London’s most prestigious boroughs.

Property demand in prime central London has been in decline for quite some time, as the market adjusts to the heightened level of price inflation recorded over the past few years.

The City of Westminster is home to the lowest level of buyer demand, at 10.14%, with Kensington and Chelsea, 11.49%, and Hammersmith & Fulham, 13.15%, also sitting in the table for lowest property demand.

Since the end of 2016, demand has dropped in all three of these boroughs, by 36.64%, 28.16% and 40.24% respectively.

Quirk explains: “London, as it usually does, will remain impervious to any lasting impact where the Brexit vote and further market uncertainty is concerned. There is an unquenchable thirst for London homeownership and the variety of property that the different boroughs offer, so it is likely the market will shrug off any trepidation seen at the start of this year.

“Prime central London, on the other hand, may see a price adjustment over the coming year, as buyer demand continues to stall and homeowners adjust the asking price of their property to account for the state of the current market.”

England

Across England, the hottest county for property demand in Q1 2017 was Northamptonshire, at 56.20%, closely followed by Bristol, 54.23%, and Suffolk, 52.25%. Despite Bristol’s continued popularity, demand has dropped by 12.93% during Q1, suggesting that prices have inflated as a result of strong buyer demand.

However, where demand growth is concerned, Northamptonshire tops the list, having seen an increase of 106.78% compared with the previous quarter. Shropshire (+46.14%), Tyne and Wear (+36.48%) and County Durham (+18.42%) have all also seen a strong uplift.

Despite the promising rise in demand, County Durham is still one of the coldest counties for buyer demand in England, at 22.75%, second only to the City of London, at 15.78%. The Isle of Wight, 24.77%, is ranked the third lowest.

Both Somerset (-2.72%) and Wiltshire (-7.00%) have recorded the largest declines of all counties in England.

Quirk continues: “Many areas of England have retained high levels of buyer demand over the start of 2017, with the London commuter hubs such as Bedfordshire and Essex benefitting from an overheated London market. Bristol has remained one of the hottest areas for property demand outside of London for quite some time now, but the Midlands and the East of England also seem to be growing in popularity, with the likes of Suffolk and Northamptonshire seeing a strong start to the year.”

Scotland

Across Scotland, the highest levels of buyer demand were found in South Ayrshire (67.18%), Edinburgh (56.47%) and Glasgow (56.42%).

Despite the country experiencing pockets of strong demand, Aberdeenshire (11.47%) and the City of Aberdeen (14.11%) continue to see buyer demand frozen.

The greatest growth in demand was in Highland (+66.59%), South Lanarkshire (+47.69%) and Fife (+40.47%).

Although demand is still low in Aberdeenshire, the area has seen an increase of 21.46% since Q4 2016. The largest declines in buyer demand were in Moray (-22.54%), Argyle and Bute (-14.20%) and Stirling (-6.33%).

Quirk responds to the data: “Scotland has had a turbulent time, due to the back-and-forth debate about its future as an independent nation. As a result, both buyer demand and property values have been unpredictable, to say the least, although the nation’s major cities seem to be holding their own.

“However, the plight of Aberdeen’s homeowners has been a result of the declining oil industry in the region, and the area has been one of the coldest in the UK for property demand for quite some time now.”

Wales

Wales has been arguably the worst hit market for buyer demand over the past year and, with the lowest average demand in the UK, the nation seems to still be recovering from the market slump.

The regions of Caerphilly (47.12%), Newport (46.92%) and Cardiff (42.89%) rank as the top three hottest areas for buyer demand.

But Cardiff’s popularity amongst Welsh buyers means that the capital has seen some of the lowest upward growth in demand, having risen by just 4.15% so far this year. Meanwhile, Rhondda Cynon Taf (+31.57%) and Swansea (+28.29%) have recorded the largest rises.

The Ceredigion (15.75%), Pembrokeshire (15.54%) and Denbighshire (13.36%) regions are home to the lowest demand in Wales, although it is important to note that there are areas across both London and Scotland with lower levels of buyer demand.

The greatest declines in Wales were in Bridgend (-13.47%), Monmouthshire (-9.63%) and Neath Port Talbot (-3.22%).

Qurik comments: “A particularly tough year for the market in Wales, due to the uncertainty surrounding the Tata steelworks and a declining economy.

“The nation is due to be worst hit by the Brexit process, so it would seem the dark clouds surrounding the Welsh property market will be staying put for the foreseeable future, despite promising signs in pockets at the start of this year.”

Gross Mortgage Lending Rose by 19% in March

Published On: April 21, 2017 at 9:10 am

Author:

Categories: Finance News

Tags: ,,,

The Council of Mortgage Lenders (CML) estimates that gross mortgage lending rose by 19% in March to reach £21.4 billion.

Gross Mortgage Lending Rose by 19% in March

Gross Mortgage Lending Rose by 19% in March

This is up from February’s lending total of £17.9 billion, but 19% lower than the £26.3 billion lent in March 2016.

This sharp annual decline in lending was expected, however, following last year’s rush to beat the Stamp Duty deadline for additional properties, which came into effect from the beginning of April 2016.

Gross mortgage lending for the first quarter (Q1) of 2017 was therefore an estimated £59.1 billion. This is down by 4% on Q4 2016 and down by 6% on the £63 billion lent in Q1 2016.The Senior Economist at the CML, Mohammad Jamei, comments: “Mortgage lending appears to be in neutral gear. Our gross estimate for March is £21.4 billion, and this is broadly in line with average monthly lending over the past year. Within this aggregate level, there has been a shift towards first time buyer and remortgage customers, away from home movers and buy-to-let landlords.

“We expect this profile to continue over the short-term, as low mortgage rates encourage existing borrowers to remortgage and Government schemes help first time buyers. We do not expect any marked effect from the General Election.”

Shaun Church, the Director of Private Finance, also responds to the data: “While mortgage lending picked up last month after February’s lull, the overall picture for Q1 was fairly subdued. The push and pull effect of strong first time buyer and remortgage activity, combined with falling buy-to-let and home mover lending, means the market is struggling to get into gear.

“The relative lack of growth in the mortgage market is not necessarily a negative sign. The fact the market is staying afloat despite last year’s turbulence and yet more uncertainty ahead is testament to its resilience. Buyer demand remains strong, with record low mortgage rates and growing product choice helping to stoke interest.”

He continues: “Mortgage lending is expected to remain steady in the short-term. However, there are hurdles on the horizon that must be addressed if the market is to stay in good health. The deficiency of property supply is contributing to the relative lack of home mover activity, and poses a serious threat to buyer affordability in the long-term.”

Top 20 Homes Hotspots for Young Buyers Revealed

Published On: April 20, 2017 at 10:01 am

Author:

Categories: Property News

Tags: ,,,

The popular seaside town of Hove has been named the top area in the UK for young buyers to purchase a home, according to a ranking of the top 20 homes hotspots for young professionals.

Landlords can use the list to choose their next property investment location, based on the fact that many buyers will choose to rent a home in their ideal hotspots before purchasing.

The East Sussex town on the south coast of England has an idyllic seaside location, good-sized homes and a family-friendly vibe.

While the average house price in the BN3 postcode is £380,000, three-bedroom houses priced between £700,000-£1m are the most sought-after, according to the Associate Director of Hamptons International’s Brighton and Hove branch, Paul Taggart.

Top 20 Homes Hotspots for Young Buyers Revealed

Top 20 Homes Hotspots for Young Buyers Revealed

He says: “Generally speaking, these requests are coming from Londoners looking for a lifestyle change. People are looking for a less populated area than Brighton, with a more laidback vibe. Properties in Hove have a slower turnover because people put down roots.”

Hove also benefits from fewer tourists than neighbouring Brighton, plus there’s a good gastro-pub scene, and great state and private schools. Hove also offers direct train links to Victoria in just over an hour.

Nevertheless, Brighton’s BN1 postcode district, which stretches from the sea into the South Downs national park, is the seventh most popular area with young professionals aged 25-44, thanks to its buzzing nightlife, forward-thinking cultural scene and direct train links to London in under an hour.

Homes in Brighton are just £4,000 more expensive than in Hove, reveals the report from Lloyds Bank, which based its figures on Land Registry transaction data for the 12 months to February this year.

How does London compare?

Southwest London is particularly popular with young professionals, with nine areas in this part of the capital making the top 20 homes hotspots.

With average house prices of £763,000, Wandsworth’s SW18 is the most popular postcode area within Greater London, and the second most popular in England and Wales.

SW16 in fast-rising Streatham is the cheapest of the SW postcodes on the list, with average values of £468,000. Meanwhile, SW6 in Fulham is the most expensive, with prices just topping £1m.

Hampstead’s NW3 postcode is the most expensive district in the capital to make the list.

Kilburn, Paddington, Hammersmith & Fulham, and Chiswick, all in west London, also appear in the top 20.

Tower Hamlets is the sole representative of east London, with the E14 postcode ranking as the sixth most popular area in the country, in part due to its £526,000 average house price, which is significantly cheaper than the majority of the capital’s most popular postcodes.

The rest of the country

Reading in Berkshire and Didsbury in Manchester are the only two other locations outside of London to make the top 20.

In 18th place, Reading offers 30-minute direct trains into the capital and an average house price of £265,000. With Crossrail due to connect the city to central and east London from next year, it’s also increasingly popular with Londoners looking for more space and better value for money.

Didsbury just makes it onto the list, in 20th place. Averaging £260,000, homes in the area are the cheapest on the list, with young professionals drawn to its independent shops, and trendy bars and restaurants.

Landlords, do any of these homes hotspots appeal to you? Investing in these areas may open you up to a wide range of potential tenants looking for idyllic places to put down roots.

The Rural Areas with the Highest Quality of Life in the UK

Published On: April 5, 2017 at 9:21 am

Author:

Categories: Property News

Tags: ,,,,

Many people are moving out of cities, predominantly London, to improve their mental health, breathe cleaner air and enjoy a higher quality of life in general. But which rural areas are the best to move to in the UK?

The Rural Areas with the Highest Quality of Life in the UK

The Rural Areas with the Highest Quality of Life in the UK

The 2017 Rural Areas Quality of Life Survey from Halifax reveals that the Orkney Islands are the best locations to settle down for a life out of the city.

The islands off the northeast coast of Scotland came out on top thanks to low crime rates, excellent, well-funded schools and the lowest anxiety levels.

Second place went to Wychavon in Worcestershire, which scored well on health, low pollution levels and well-paid employment, with the Derbyshire Dales, Hambleton in North Yorkshire and Purbeck in Dorset completing the top five.

An Economist at Halifax, Martin Ellis, comments: “With one of the lowest population densities and traffic levels in Scotland, some of the most stunning scenery in the British Isles, and the lowest levels of anxiety and highest life satisfaction ratings, the Orkneys offer a quality of life unmatched elsewhere in rural Britain.

“While the employment rate is significantly higher than the national average, there is more and more emphasis being placed on achieving a good work-life balance.”

Scottish island groups fared well overall, with the Shetlands and Western Isles also ranking in the top 50 rural areas to live.

While areas in the south of England appeared most frequently in the top 50, rural areas in the north of England scored better on education, lower house prices to earnings ratios, lower traffic flows and population densities.

In contrast, typically richer southern areas tended to do better for weekly earnings, the weather, health and life expectancy.

The benefits of living in southern rural areas come at a price, however, with the highest house price to earnings ratios in Tandridge, Surrey (11.3), Purbeck (10.8) and East Dorset (10.7).

The study’s findings also suggested that Londoners needn’t cut all ties with the capital to achieve a better quality of life, as 11 of the top 50 best rural areas to live are in the South East.

Commuter favourite Chiltern in Buckinghamshire – number seven in the rankings – scored highest for educational attainment, with 55% of the adults educated to a high level, compared with a national average of 36.5%. It also boasts some of the country’s largest homes.

Landlords, if you’ve decided against a London property investment due to high house prices and low rental yields, head to these rural areas to cater to those looking for a higher quality of life.

UK Ideal Home Size among Largest in the World, Survey Reveals

Published On: April 4, 2017 at 8:36 am

Author:

Categories: Property News

Tags: ,,,,

Real estate blog Point2 Homes asked 29,000 people from nine countries about their current and ideal home sizes, to get a global perspective on typical residences and home size expectations. According to the survey, Brits have the fourth largest homes on average among surveyed countries, but ideal home size expectations are even bigger.

The nine countries surveyed were the UK, the USA, Canada, Australia, France, Germany, Spain, Mexico and Brazil. Here are some key findings:

  • 38% of British residents surveyed said their ideal home should exceed 2,501 square feet of space
  • Almost two thirds of UK respondents said their ideal home should be larger than the one they already live in
  • UK respondents have the same ideal home size expectations as respondents from Mexico and Australia
  • The UK and France are tied when it comes to the average current home size– between 1,500 and 1,600 square feet

The expectations of British respondents may come as a surprise, considering that Americans, Canadians, and particularly Australians are the ones better known for their love for large homes. However, considering that the average Canadian home is over 200 square feet larger than the British equivalent, American homes are 400 sq. ft. larger, and Australian homes 500 sq. ft. larger, the Brits’ desire for more room makes sense.

UK Ideal Home Size among Largest in the World, Survey Reveals

UK Ideal Home Size among Largest in the World, Survey Reveals

Britain in 4th place for average home size

The answers tallied during the survey show great diversity, both in terms of home sizes and expectations. Australia, for example, has the largest homes by far, but also wants the largest homes. Brazil, on the other hand, has the smallest average home size among surveyed countries, while expectations here are mostly reasonable.

At 1,590 square feet, British homes are larger than those in other European countries, like France, Germany, or Spain. In fact, the UK comes closest to entering the top three countries with the largest homes among the nine surveyed, behind Canada by only 10%. The US and Australia are in a league of their own, with average home sizes hovering around 2,000 sq. ft.

Britain in 1st place for largest ideal homes

However, the ideal home size is a different story, as residents of some countries simply like to dream big. Here, the UK is in the lead, with the biggest gap between average actual home size and ideal residence. 38% of Brits surveyed think the ideal home should be over 2,501 sq. ft. in size.

23% of responders in the UK say their ideal home would be larger than 3,000 square feet. Only Australians come close, with 21% of respondents stating that their ideal home would be at least 3,000 sq. ft.

The Australian’s homes surveyed are 2,032 sq. ft. on average, but most respondents think homes of over 2,501 sq. ft. would be ideal. Oddly enough, residential developers down under are building smaller homes, while recent reports in Britain show that the average size of a newly built home has been increasing since the 1990s.

Mexico isn’t far behind in terms of lofty home size expectations, as 32% of respondents stated that their ideal home size should exceed 2,501 square feet.

Brits enjoy little individual personal space, driving preference for larger homes

Brits enjoy little individual personal space, driving preference for larger homes

Brits enjoy little individual personal space, driving preference for larger homes

While average home size is an important metric, according to a report by the Royal Institute of British Architects (RIBA), property listings in the UK focus much more on the number of rooms in a house. Why? Because individual personal space is perhaps more relevant to homebuyers than total house size.

“Unlike in many other countries, homes are marketed by the number of bedrooms rather than floor space. This idiosyncrasy of the UK housing market means that space is not easily understood or translated into any meaningful information for consumers,” states Rebecca Roberts-Hughes, author of the RIBA report.

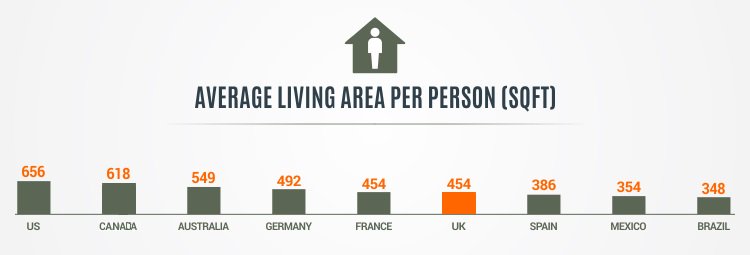
Divide the average UK home size by the average number of family members among respondents, and the result is 454 square feet per person. This figure places Britain among the countries with least individual living space.

Brits still have more breathing room in their own homes than Spaniards, Mexicans or Brazilians. Germans, on the other hand, may have smaller homes, but the survey data shows that they also have smaller families on average, which gets them more space per person than the French or the British.

The survey results also highlight the differences between what is typical in European countries, and what is typical in countries from the Americas and Australia. Generally, the latter tend to build larger homes. Among the European countries surveyed, Britain still reigns supreme in terms of home size. Ultimately, the survey shows that Brits are the biggest dreamers of all.

Methodology

The Point2 Homes survey was made in Google Surveys and distributed to users via the Point2 Homes real estate platform and many other real estate websites in all surveyed countries, in the form of an optional pop-up. Point2 Homes analysts tallied and correlated the answers in-house.