Posts with tag: Bective

Government releases latest data for average UK house prices

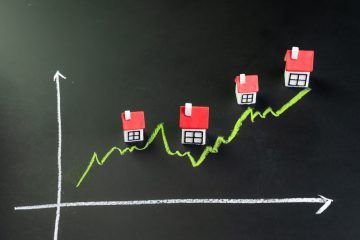
The latest government House Price Index records the average UK property price as £270,708 for November 2021.

This is a 10.0% annual increase and a 1.2% monthly increase.

Iain McKenzie, CEO of The Guild of Property Professionals, comments: “The average home now costs over £270,000, and with an annual price change of 10%, it’s sobering to think that buyers are now paying £27,000 more than they did at the tail end of 2020. 

“These figures include the annual rush to snap up property ahead of Christmas and the New Year, with buyers keen to move in ahead of the holidays. 

“The one constant in the last few months of housing data is a strong, confident rise in prices, driven by the imbalance between supply and demand.

“Estate agents’ portfolios are at historic lows, with many branches having a dozen or fewer properties to sell, and there is no sign of this situation changing.

“Despite rising inflation, consumer confidence is high, and growing optimism that the Omicron wave is waning will continue to push house prices steadily higher.”

James Forrester, Managing Director of Barrows and Forrester, comments: “Any fears that the end of the stamp duty holiday would bring about a decline in house price growth can now be well and truly put to bed. Not only has the market maintained momentum, but it’s continued to shift through the gears during what is usually a quieter period in the year.

Expect more of the same in 2022, as demand remains robust, stock remains scarce and the cost of borrowing remains very affordable.”

Marc von Grundherr, Director of Benham and Reeves, comments: “It’s extremely reassuring to see such a sustained run of positive price growth and while the government stimulus of a stamp duty reprieve helped to kick start this pandemic property market defiance, it’s now abundantly clear that the sector is standing tall on its own two feet. 

“A slight slow in pace is inevitably on the cards as the industry took a well earned break during the Christmas period, but we’ve seen strong signs already this year that this market momentum has carried on where it left off in 2021.”

Geoff Garrett, Director of Henry Dannell, says: “Despite an increase in interest rates, the cost of borrowing remains very favourable for the nation’s homebuyers and we’re yet to see this appetite dampened by the marginal jump introduced by the Bank of England towards the end of last year. 

“In fact, it’s those purchasing with the help of a mortgage who are driving the hefty rates of house price growth currently being seen, as many borrow that little bit extra to buy bigger in the wake of pandemic lockdown restrictions. Not only is the average rate of growth higher for mortgage buyers versus cash buyers, but detached homes continue to lead the pack where house price growth by property type is concerned.”

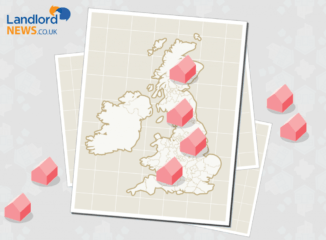
Craig Tonkin, Bective’s Head of Sales, says: “While London is still lagging behind where top line price appreciation is concerned, we’ve seen a healthy level of activity return to the capital over the last year and this looks set to continue in 2022 with foreign demand expected to drive an uplift in transactions and sold prices. 

Of course, the pandemic influence of the last 18 months remains clear with many buyers across the core market looking to the likes of Wandsworth due to the greater abundance of larger family homes. However, at the very top price thresholds of the market, the prime central heartlands of Kensington and Chelsea and Westminster remain some of the most active areas.”

The full report is available on the HM Land Registry website.

UK house prices see ‘marginal decline’ in October 2021

Published On: December 16, 2021 at 9:21 am

Author:

Categories: Property News

Tags: ,,,,

The latest Government House Price Index states that the average price of a property in the UK was £268,349 in October 2021.

The report states that this is an annual increase of 10.2%, down from 12.3% in September 2021. The monthly price change was -1.1%.

James Forrester, Managing Director of Barrows and Forrester, comments: “A marginal decline following the final curtain of the Stamp Duty holiday was always on the cards but a 1% monthly drop is far from the market collapse that many have been expecting.

“The real proof in the pudding is the annual rate of appreciation and this is the third consecutive month where house prices have climbed by more than 10% year-on-year.

“Based on the market trends seen following the initial Stamp Duty holiday deadline, we can expect house prices to bounce back on a monthly basis ahead of the Christmas break, as many push to complete before Santa comes to visit.”

Craig Tonkin, Head of Sales at Bective, comments: “While we’re now starting to see signs of the market cooling across some areas of the UK, London continues to build momentum with one of the strongest rates of monthly house price growth of all regions.

“This has been driven by an influx of foreign interest at the top end of the market and we’re seeing larger family homes, in particular, go under offer at pace due to a severe shortage of supply.

“With growing demand for London homes, the capital looks set to enjoy a sustained level of house price growth throughout the remainder of the year and well into 2022.”

Nicholas Christofi, Managing Director of Sirius Property Finance, comments: “Although the end of the Stamp Duty holiday and a potential increase in interest rates is expected to cause a market slowdown early next year, we’re unlikely to see any notable reduction in buyer demand and therefore house price growth should remain steady, at the very least.

“A potential interest rates increase will cause many buyers to pause for thought before transacting. However, we’re already seeing measures to reduce this impact with the Bank of England removing the mortgage rates rise stress tests and a number of mortgage providers already starting to offer some very favourable deals.”

Nationwide records slight increase in house prices during November

The Nationwide House Price Index for November records a slight increase in annual house growth, now sitting at 10.0%. This is up from 9.9% in October.

Prices are also up 0.9% month-on-month.

Lucy Pendleton, property expert at independent estate agents James Pendleton, comments: “This market is still barrelling along, even at a time of year that traditionally sees a little energy taken out of it.

“Fewer people choose to move home at Christmas and that normally means you see buyers drop the pace, with many holding off their search until after the New Year. 

“That’s happening to a lesser degree this year but more so for buyers than sellers. This is worsening the supply crunch temporarily and that’s undoubtedly why we’re back in double digits.

“One obvious reason for this is the threat of inflation. With interest rate rises stealing plenty of headlines, everybody has become an armchair economist. It’s common knowledge that rates are historically low and are going to climb soon. The rush to beat rate rises is fuelling an unusually busy market. Mortgage approvals are still running hot as a result so we’re bracing ourselves for an unusually intense December.”

Iain McKenzie, CEO of The Guild of Property Professionals, says: “Britain’s year on the move continues, with more properties sold already this year than were sold in the whole of 2020.

“Prices are still climbing due to a shortage of stock available to prospective buyers, with many of those working from home still desperately hunting for a larger property and more space.

“There is still some uncertainty in the market, with the new Omicron variant warning people that it’s not business as usual. 

“As long as the labour market remains buoyant and mortgage approvals continue at their current levels, it is likely that the demand for property will remain steady as we move into 2022.”

Craig Tonkin, Bective’s Head of Sales, comments: “While the chances of a white Christmas are slim, property market momentum continues to snowball. As we head into the final stretch of 2021 it’s quite remarkable to not only see a sustained level of high transactional volume but yet another dose of double-digit house price growth.  

“There’s no doubt this is partly being driven by the returning health of the London market. While there are signs that the rest of the market is cooling, the region has gone from strength to strength in recent months. 

“This is not only due to an uplift in domestic activity but also from returning foreign demand across the top tier of the market. We’ve also seen a very strong uplift in rental demand and the combination of all of these factors is helping to push the dial.”

Colby Short, founder and CEO of GetAgent.co.uk, comments: “House prices continue to climb despite fears around an interest rates increase and it seems as though the only person that will be working harder than the nation’s estate agents this December is Father Christmas himself. 

“There’s been absolutely no let-up in buyer demand this year and this coupled with ongoing supply limitations has been the driving factor behind such a jolly level of house price appreciation.”

Nicky Stevenson, Managing Director at national estate agent group Fine & Country, says: “House prices remain stubbornly high despite transaction levels beginning to relax following the record surge in activity earlier in the year.

“A poor supply of housing stock has been insufficient to meet the scramble for bigger homes with more outdoor space, and it’s too early yet to predict whether the new strain of Covid will dampen price growth in the future.

“While there’s certainly no evidence that we may be about to move into lower gears, we could experience an easing off from double digit growth in the months ahead.

“For the time being, the market remains buoyant and prices continue to skyrocket.”

Tenant applications for London rental properties double in last six months

Published On: November 10, 2021 at 11:07 am

Author:

Categories: Lettings News

Tags: ,,

The number of new lettings applicants in London climbed by 34% in the six months between October 2020 and March of this year, compared to the previous six months (April 2020 to September 2020), research shows.

However, this analysis from London estate agency Bective also reveals that the level of tenant applications for London rental properties has more than doubled in the last six months alone. It is up by 104% versus the previous six months (October 2020 to March 2021) and 173% when compared to the peak of the pandemic last year (April 2020 to September 2020).

Bective’s research shows that this tenant interest is also becoming apparent beyond the lettings application stage.

39% of London rental properties listed on the market have seen a let agreed in the last six months, according to the findings. This is up from 36% between October 2020 and March 2021 and 33% between April 2020 to September 2020. The number of rental properties as a proportion of all stock listed online (sales and rentals) has also started to drop, following a surplus on the market due to a drop in demand.

The research highlights that just 34% of all properties listed are now rental properties, down from 42% in the previous six months and 42% in the six months prior to that.

Thomas Dainty, Bective’s Head of Lettings and Property Management, comments: “It’s fair to say that the green shoots of rental market positivity that had started to spring at the back end of last year have now blossomed quite considerably and we’re now seeing the London rental market start to build a real head of steam.

“Not only are we seeing a strong uplift in the number of those enquiring, but these enquiries are also converting which is something we simply weren’t seeing during peak periods of pandemic uncertainty.

“This renewed intent is helping to clear the backlog of rental market stock that had otherwise sat dormant for much of last year. The result of which has been a boost to rental values and we anticipate rents to recover to pre-pandemic levels as a result of this continued demand and positive sentiment.

“We’ve already started to see rental values climb considerably for homes providing more space and the most suitable units have been subject to multiple bids, with the rent achieved up by some 10% on last year already.”

The six-month changes in new lettings applications and total levels of tenant demand and rental stock levels

Time periodChange in new lettings applications %Tenant demandRental stock
Apr 2020 to Sep 2020N/A33%42%
Oct 2020 to Mar 202134%36%42%
Apr 2021 to Sep 2021104%39%34%
SourceBective applications via Rightmove, Zoopla, On the Market and their own websiteRightmove (based on the number of rental properties Let Agreed, as a percentage of all rental properties listed)Rental properties as a percentage of all stock listed (sales and rentals)

New HMO licensing rules could impact London’s biggest rental market

Published On: October 13, 2021 at 8:40 am

Author:

Categories: Landlord News,Law News

Tags: ,,,

Research by central London estate agency Bective has revealed how new HMO licensing rules will impact London’s biggest rental market, Westminster.

The new rules came into force in Westminster at the end of August 2021. They state that shared houses or flats where 3 or more people from 2 or more households share facilities now require licensing as HMOs (houses in multiple occupation). This is in replace of the rule that stated an HMO license wasn’t mandatory until 5 or more people were sharing facilities.

Bective’s research highlights that Westminster is the largest private rental market in London, where private rental stock accounts for 27% of all dwellings. In Westminster, this number rises to 42% of dwellings, followed by the City of London (41%) and Kensington & Chelsea (37%).

Top 10 boroughs ranked top to bottom for private rent as % of total stock

LocationPrivate rental % of total stock
Westminster42.1%
City of London41.1%
Kensington and Chelsea37.2%
Newham36.0%
Tower Hamlets34.5%
Hammersmith and Fulham33.0%
Haringey32.7%
Wandsworth32.4%
Camden31.8%
Brent31.0%
London26.80%
Source – ons.gov.uk

Westminster also has the 6th largest number of existing HMOs (9,539) of all London boroughs, trumped only by Ealing (20,429), Brent (16,984), Lambeth (12,000), Tower Hamlets (10,000), and Enfield (10,000).

Over the past three years, Westminster has seen the 8th largest increase in the number of HMOs, up 19% between 2017 and 2020, behind Hillingdon (668%), the City of London (614%), Lambeth (532%), Tower Hamlets (67%), Newham (58%), Waltham Forest (53%), and Harrow (36%).

Total number of HMO properties in London boroughs in 2017 and 2020, ranked from biggest 3-year increase to smallest

LocationEstimate of total number of HMOs 2016 to 2017Estimate of total number of
HMOs 2019 to 2020
3 year change
Hillingdon6515,000668%
City of London14100614%
Lambeth1,90012,000532%
Tower Hamlets6,00010,00067%
Newham6,0009,50058%
Waltham Forest3,9005,95153%
Harrow8801,20036%
Westminster8,0009,53919%
Greenwich6,5007,50015%
Hackney4,2694,71710%
Brent16,00016,9846%
Hounslow1,8001,8503%
Havering2652671%
Sutton1,2001,2000%
Ealing20,42920,4290%
Kingston upon Thames4,8004,8000%
Barnet5,9305,9300%
Croydon3,0003,0000%
Camden8,0008,0000%
Kensington & Chelsea4,4344,000-10%
Bromley2,3002,074-10%
Bexley1,4001,200-14%
Redbridge5,0004,000-20%
Enfield14,20010,000-30%
Barking & Dagenham300192-36%
Haringey12,0006,000-50%
Hammersmith & Fulham6,6333,000-55%
Lewisham14,8106,000-59%
Southwark13,0005,020-61%
Merton5,5682,040-63%
Richmond upon Thames51097-81%
Wandsworth15,000820-95%
IslingtonN/A400 
London overall194,693172,810-11%
Sources – Gov.uk LA Housing Data,Gov.uk LA Housing Statistics

Westminster also ranks 12th in terms of current HMO numbers as a percentage of all rental stock (18%), a list that is topped by Ealing (53%), Brent (46%), and Enfield (32%).

HMOs as a percentage of private rental stock in top 20 London boroughs, ranked from largest percentage to smallest

LocationEstimate of private
rentals (2019)
Estimate of total number of HMOs 2019 to 2020HMOs as % of private rental stock
Ealing38,90420,42952.5%
Brent37,28316,98445.6%
Enfield31,05110,00032.2%
Greenwich25,1917,50029.8%
Kingston upon Thames16,3704,80029.3%
Lambeth42,24512,00028.4%
Tower Hamlets41,88510,00023.9%
Camden33,6258,00023.8%
Hillingdon22,0295,00022.7%
Newham42,1249,50022.6%
Waltham Forest28,0595,95121.2%
Westminster52,7919,53918.1%
Lewisham33,2776,00018.0%
Haringey35,7816,00016.8%
Redbridge26,3364,00015.2%
Southwark35,0395,02014.3%
Barnet42,2355,93014.0%
Hackney34,1004,71713.8%
Kensington and Chelsea32,6704,00012.2%
Hammersmith and Fulham29,3993,00010.2%
London overall963,794172,81017.9%
Sources – Gov.uk LA Housing Data,ONS

However, with these changes now in force, Bective points out it is likely the number of HMOs within the borough will now spike.

Tom Dainty, Head of Lettings and Property Management at Bective, comments: “The impact of these new rules will be two-fold. Yes, it’s undeniable that additional HMO licensing and tighter scrutiny when dealing with rule-breakers will benefit tenants by raising the standard of living.

“But, at the same time, this increased scrutiny, along with the additional costs, might tempt landlords to up sticks from Westminster and find more profitable investments elsewhere.

“This exodus will be of detriment to tenants. Less landlords means less stock, and less stock means higher rent prices. With Westminster’s average rent already more than £2,600 a month, this could further price more tenants out of the borough.”