Posts with tag: annual house price growth

Property price inflation at lowest in 4 years

Published On: August 14, 2017 at 10:31 am

Author:

Categories: Property News

Tags: ,,,

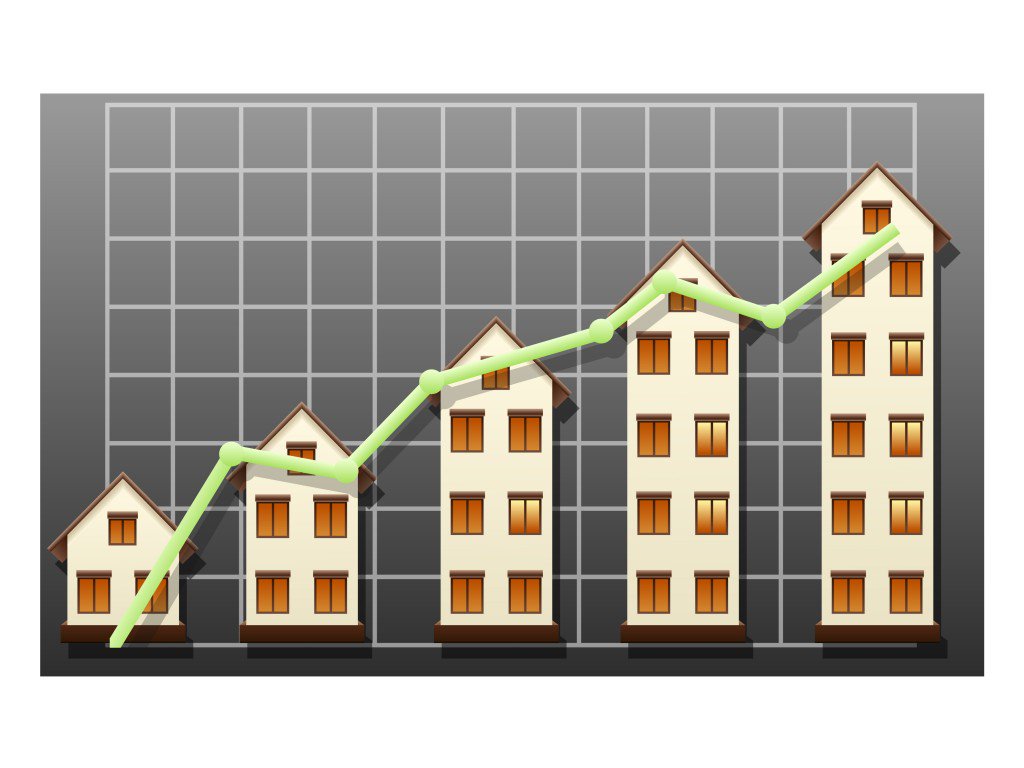
The most recent data and analysis from Your Move has revealed that the housing market paused for breath in July, with a fall of 0.2%. This reduced the annual rate of house price inflation to 2.9% – the lowest since July 2013.

According to the figures, the average house price in England and Wales increased by £8,433. Monthly prices now stand at £298,906. In addition, transactions slowed, falling by an estimated 9% in July month-on-month.

Despite the slowdown in monthly transactions, yearly activity data indicates regions such as London and the East of England are continuing to see strong growth.

Demand

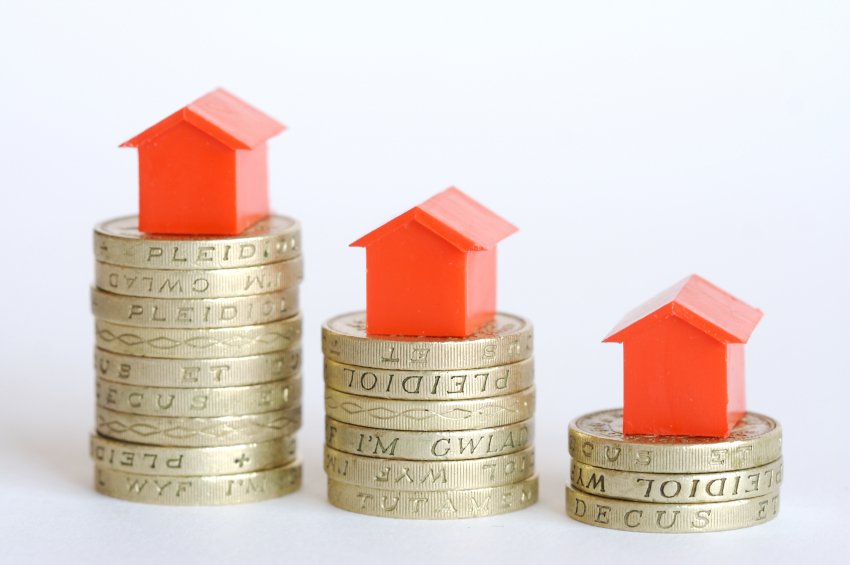
Each region of England and Wales saw annual growth as demand for property continues to increase.

Every UK region is still showing annual growth, however all slowed in July. The largest falls were evident in Wales, dropping by 1.5% to only 0.2% in the year. Other falls were seen in the West Midlands and Yorkshire and the Humber, where annual growth rates fell by 1.3% and 1.2% to hit 3.3% and 1.5% in the year respectively.

On the other hand, South West prices are up by 4.2% annually, while the East Midlands saw a rise of 4.1%. The most prominent rises were seen in the East of England, where annual price inflation increased by 5.1%.

Property price inflation at lowest in 4 years

Property price inflation at lowest in 4 years

North-South Divide

The figures suggest that there is a re-emerging North/South divide, with northern regions recording slower growth than southern locations.

Eastern locations of England continue to perform strongly, led by Southend-on-Sea and Luton & Bedfordshire, where annual growth is 10.2% and 8% respectively.

Oliver Blake, Managing Director of Your Move and Reeds Rains, noted: ‘Annual prices are still rising positively and regions continue to perform strongly – despite the slowdown in transaction numbers over the summer months. Whilst, as a business, we often see this at this time of year, the cause of the dip may also be down to the buy-to-let slowdown as a result of tax changes.’[1]


[1] http://www.propertyreporter.co.uk/property/house-price-inflation-at-lowest-level-in-four-years.html


House price growth slows in April

Published On: April 28, 2016 at 1:22 pm

Author:

Categories: Property News

Tags: ,,,

The latest data released from the Nationwide Building Society shows UK house prices slowed in April, following a surge in activity during March.

Annual house price growth was revealed to have slowed to 4.9% in April, in the comparison to 5.7% recorded in the last month.

Slow growth

April has seen house price growth of just 0.2%, which is the lowest monthly rise since November 2015.

In addition, the Royal Institution of Chartered Surveyors has also suggested that demand for commercial property has dropped to a record low. The institution concluded that international investors have been deterred by the uncertainty caused by the pending EU referendum.

Nationwide noted that April’s slowdown in house prices comes after the highs in March, which were caused by residential landlords rushing to beat the additional stamp duty deadline.

During March, there were 165,400 transactions, according to official data from HM Revenue and Customs.

Robert Gardner, chief economist at the Nationwide, said, ‘it may be that the surge in house purchase activity resulting from the increase in stamp duty on second homes from 1 April provided a temporary boost to prices in March.’[1]

Highs

Figures from the report show that the average price of a flat or UK increased to a new high of £202,436 in April.

Gardner observes, ‘house purchase activity is likely to fall in the months ahead given the number of purchasers that brought forwards transactions. The recovery thereafter may also be fairly gradual, especially in the buy-to-let sector, where a wealth of other policy changes, such as the reduction in tax relief for landlords from 2017 are likely to exert an ongoing drag.’[1]

House price growth slows in April

House price growth slows in April

Uncertainty

The survey from RICS underlines that uncertainty being created by the Brexit vote. RICS said that demand from foreign investors for UK commercial property is at its lowest for three years.

Simon Rubinsohn, chief economist at RICS, feels, ‘there is no doubt that since the EU referendum became a certainty following the general election last May, we have seen a decline in interest from overseas investors in UK commercial property.’[1]

‘At least in the short-term, we know that international retailers and service providers are finding the UK market less attractive,’ he added.[1]

[1] http://www.bbc.co.uk/news/business-36153571

Annual house price growth slows

Published On: September 28, 2015 at 2:46 pm

Author:

Categories: Landlord News

Tags: ,,

New data from the Land Registry indicates that the average price of a UK property increased at its lowest annual rate since November 2013, with a recorded rise of 4.2%.

Rises

During August, house prices rose by 0.5% in comparison to July, bringing the average property value in England and Wales to £184,682.[1]

In addition, data from the report shows that the total number of transactions has decreased during the last twelve months. Between March 2014 to June 2014, there was an average of 73,985 sales per month, which dropped to 65,550 in the same three month period one year later.[1]

What’s more, the number of completed house sales in England and Wales dropped by 13% to 70,404, in comparison to 80,823 in June 2014.[1]

Regional rates

Regionally, data shows that the region with the greatest annual price increase is the East, where movement rose by 8.4%. London saw the top rise in property prices in August, with values increasing by 1.7%.[1]

The North West saw both the lowest monthly and annual property price growth, with prices falling 0.2% annually and by 1.4% in August. In total, the number of properties sold in England and Wales for over £1m fell by 17% to 1,031 from 1,237 twelve months previously.[1]

More positively, repossessions in England and Wales dropped by 43% to 498, in comparison to 868 in June 2014. Once again, the capital led the way, seeing the most prominent fall in the number of repossession sales.[1]

Annual house price growth slows

Annual house price growth slows

Encouraging

‘House prices are still rising, however it is encouraging to see some moderation in the rate of growth, with this being the slowest annual increase for two years, a statistic that will no doubt be well received by prospective buyers,’ said John Eastgate, Sales and Marketing Director of One Savings Bank. ‘With wage inflation now at a six year high, more moderate house price growth bodes well for the long-term health of the property market and it should help reduce some upwards pressure on affordability,’ he continued.[1]

Mr Eastgate believes however that we should, ‘avoid focusing too much on the short term,’ saying, ‘this month’s figures might show that price growth has slowed but the fundamentals are such that growth is inevitable over the long-term. Ultimately, the supply and demand imbalance will sustain property values. The UK is still desperately short of new housing, yet a combination of historically low mortgage rates and improving access to mortgage finance is sustaining demand.’[1]

Supply stagnation

Jeremy Duncombe, Director of Legal & General Mortgage Club, said, ‘the lack of supply is continuing to drive a wedge between house price inflation and earnings growth. He believes that, ‘as a result, homes are becoming increasingly unaffordable, putting them out of reach for many aspiring homeowners. The longer this continues, the larger the housebuilding deficit will become, making the housing crisis progressively more difficult to resolve.’[1]

‘It’s crucial that the Government and the industry work together to remove any barriers that may be limiting construction. Housebuilders are faced with a shortage of skilled workers, materials to build with, and land to build on. It’s great to see that the Government has announced a target of 1 million new homes by the end of this parliament, but this is unlikely to come to fruition until these housebuilding constraints are addressed. Construction has been insufficient for a number of years, and we need a long-term solution to this problem, rather than just a short-term pledge,’ Duncombe concluded.[11]

[1] http://www.propertyreporter.co.uk/property/annual-house-price-growth-stagnates.html


House Prices Rise 0.3% But Annual Growth Slows

Published On: August 27, 2015 at 1:49 pm

Author:

Categories: Finance News

Tags: ,,,,

UK house prices rose by 0.3% in August, but annual growth has slowed from 3.5% to 3.2%, according to the latest residential property index from the Nationwide.

The figures reveal that the average house price is now £195,279 in the UK, and the lender’s chief executive, Robert Gardner, says that the drop in the annual growth rate was caused by a particularly high price increase in August 2014.

However, the annual rate of growth was the weakest since June 2013. Gardner explains: “This month’s data provides further evidence that annual house price growth may be stabilising close to the pace of earnings growth, which has historically been around 4%.

“However, survey evidence cautions that this trend may not be maintained unless construction activity accelerates. Surveyors reported the lowest ever number of properties on their books in July, whilst new buyer enquiries picked up.”

House Price Rise 0.3% But Annual Growth Slows

House Prices Rise 0.3% But Annual Growth Slows

He notes that UK house prices have shown strength recently, in comparison with other developed economies.

For example, house prices in the UK did not decrease by as much during the financial crisis, and even when they did fall, they quickly recovered to pre-crisis levels.

At present, UK house prices are around 5% higher than their pre-crisis levels, while prices are still much lower than the pre-crisis peaks recorded in Ireland, down 38%, Spain, down 36%, and the Netherlands, down 18%.

Gardner continues: “Clearly house price trends are determined by a wide range of factors, but labour market developments are amongst the most important. The strength of the UK labour market in recent years is a key reason why house prices have recovered more quickly.

“There is a strong correlation between employment and house price growth since the financial crisis across the major developed economies. House prices remain further below their pre-crisis peaks in countries where employment is also well below pre-crisis levels.

“Supply side developments also play an important role in explaining the divergence in house price performance. The UK experienced a much smaller increase in building activity in the run up to the financial crisis. As a result, there was much less of an overhang of unsold properties to be worked off in recent years.”

He concludes: “However, with UK house building running well below the expected rate of household formation in recent years and with demand for homes rising, a significant increase in construction activity is required if affordability is not to become stretched in the years ahead.”1

Online estate agent HouseSimple’s Alex Gosling says that any belief that vendors are returning to the market is inaccurate.

He claims: “A boost to new stock levels in June suggested that we were finally starting to see some movement from sellers, but that momentum seems to have been short lived. The general election, which the market hoped would provide a catalyst for sellers, is long gone and property stock numbers remain well below normal levels.”

He thinks there are many reasons why people are not moving house, including the fact that they simply can’t afford to, as property prices have soared, or because they are not confident in the market, despite the strength of the economy and the extremely low mortgage rates currently on offer.

He suggests: “Somehow, sellers need to be encouraged back to the market because there are buyers galore waiting when they do. It’s a very attractive market right now for motivated sellers.

“The next few months are going to be important, as the property market looks to gather momentum heading into the last quarter of the year. We fully expected activity to drop off in the summer months, but come the autumn, the market needs to be replenished with stock to realign the supply versus demand balance.”1 

1 http://www.propertywire.com/news/europe/uk-national-house-prices-2015082710913.html


Annual house price growth above 2007 peak

Published On: July 28, 2015 at 4:02 pm

Author:

Categories: Finance News

Tags: ,,

Official property data from the Land Registry indicates that annual property price growth in England and Wales during June took values to a record high.

Figures from the report show that prices grew by 5.4% last month, escalating prices to an average of £181,619. This figure was more than the previous record of £180,983 in November 2007.[1]

Regional results

Regionally, the largest price increase was recorded in London, where house prices were up by 9.2% annually. By month, the largest increase was in the North East, at 3%. In contrast, the lowest annual rise was found in Yorkshire and the Humber, where prices went up by 1.4%, while by month, the region also had the worst result, with values dropping by 0.9%.[1]

In the North East, there was a 3% monthly rise in home values with a 2.4% annual increase, whereas in the North West, prices rose by 0.2% and 3.6% respectively. Wales saw hikes of 1.7% in the month and 2.7% year-on-year.[1]

For the South West, prices rose by 0.8% over the month and by 5,2% over the year, whilst the South East saw 0.4% and 8.4% rises respectively. The price of a home in the region is now £247,375. In London, there was a 1.8% monthly rise, with an annual increase of 9.2%, taking the average price of a home in the capital to £481,820.[1]

The East of England saw prices fall by 0.8% in June but a 7.8% increase on the same period twelve months ago, taking prices here to £203,428. Additionally, the East Midlands saw rises of 0.7% in the month and 5% over the year; meaning prices are currently £134,965. For the West Midlands, prices fell by 0.2% monthly but were up by 2.1% since 2014.[1]

Annual house price growth above 2007 peak

Annual house price growth above 2007 peak

Types

By property type, detached homes have seen an annual increase of 5.4% to stand at £284,478, with semi-detached properties rising by 5% to reach £171,154. Terraced houses saw a similar increase of 5.4% to £137,123 and flats rose in value annually by 5.6% to £174,523.[1]

Homes sold that were valued at more than £1m in England and Wales fell by 22% in the twelve-month period, whereas repossessions also decreased by 48%.[1]

‘Confidence at the bottom of the market is particularly strong and it is the region with the lowest average house price, the North East, that has seen the biggest monthly improvement in prices, as cheaper mortgage finance and government support schemes inject more energy into areas where the recovery needs a careful watch,’ commented Adrian Gill, director of Your Move and Reeds Rains estate agents.[1]

Gill said that while this appears promising, ‘prices will only head north if the supply of new homes coming onto the market dries up.’ He noted that, ‘growth in the construction industry was flat during the second quarter of this year, which should be ringing alarm bells. Buyers’ purchasing power has rarely been stronger, but this golden opportunity will be spoiled if there’s nothing for them to buy.’[1]

Confidence

Peter Rollings, chief executive officer of Marsh & Parsons feels the fact the majority of regions are posting monthly rises in property value shows that confidence is coming back to the market following election uncertainty. ‘London continues to be at the forefront of this and prime postcodes have enjoyed quarterly upticks after an uncertain period at the beginning of the year,’ Rollings observed.[1]

[1] http://www.propertywire.com/news/europe/england-wales-home-prices-2015072810798.html


Annual Property Price Growth Slows

Published On: June 4, 2015 at 2:21 pm

Author:

Categories: Landlord News

Tags: ,,,

Annual Property Price Growth Slows

Annual Property Price Growth Slows

Annual property price growth in the UK slowed to 4.6% in May, down from 5.2% in April, according to the latest Nationwide house price index.

House prices increased by an average of 0.3% last month, compared to a 1% rise in April. The average property price was £195,166 in May, up from £193,048 in the previous month.

Chief Economist at Nationwide, Robert Gardner, forecasts house price growth to reflect income increases, which is currently around 4%.

He says: “The annual pace of house price growth slowed to 4.6% in May. This resumes the gradual downward trend that had been in evidence since the summer of 2014, which was briefly interrupted in April when house price growth edged up to 5.2% from 5.1% in March.

“Over the longer term, we would expect house price growth to converge with earnings growth, which has typically been around 4% per annum.

“However, much will depend on supply side developments; in recent years, the rate of building activity has remained well below that required to keep up with population growth.”1

1 http://www.propertyflock.co.uk/f/8416B41FC