Posts with tag: average London rents

Tenants in London spend 2/3’s of income on rent

Published On: June 9, 2016 at 9:01 am

Author:

Categories: Finance News

Tags: ,,,

Tenants in London are now spending 70% of their average income on rent and bills, according to new, concerning research.

A study conducted by Portico London estate agents has found that three and half days wages are typically needed to fund rents, taxes and household bills.

Capital rents spiralling

The research from Portico suggests that the average worker in London has around £201 in disposable income to spend on food and luxury items.

Analysis was conducted on a borough level, adjusting the value of rent, council tax and travel to zone 1 accordingly. Using the average London yearly salary of £34,320, the investigation found that Londoners renting in Bexley had the largest amount of disposable income leftover following rent and bills with £287.

At the other end of the scale, renters in the City of London were found to have the lowest amount of disposable income at the end of each week, with just £32.

Tenants in London spend 2/3's of income on rent

Tenants in London spend 2/3’s of income on rent

Skyrocketed

Robert Nichols, managing director, commented, ‘Londoners have to work increasingly later into the week before they start to spend some of their hard-earned money. Working for five hours alone to pay income tax, plus almost two days on rent, clearly shows how private rents in the capital have skyrocketed.’[1]

‘But while rents are increasing, public transport is also improving significantly, so we’re seeing a huge number of tenants move further out to boroughs like Bexley, Barking and Dagenham and Ealing to benefit from affordable rents, a quick commute, (which will become even better with the arrival of Crossrail) and a good sum of disposable income in their pockets at the end of each week,’ Nichols added.[1]

[1] https://www.landlordtoday.co.uk/breaking-news/2016/6/londoners-now-spending-more-than-two-thirds-of-income-on-rent

Alternative Tube Map Shows Average Rent at Each Station

A new alternative Tube map shows how much it costs to rent near each London Underground station in the capital.

The map, compiled by Thrillist.com, reveals the sky-high prices tenants must pay for a one-bedroom home within a kilometre of each Tube station.

The illustration uses data from property website, Find Properly, and highlights the highs and lows of the central London rental sector, including prices in thriving tourist areas, such as Oxford Circus and Leicester Square.

Another super expensive area on the map is Bank, which is at the heart of the City of London financial district. One-beds here can cost £2,128 per month.

Renters in the upmarket West London areas of Hyde Park Corner and South Kensington are also paying similar prices.

However, the map does indicate a divide in prices, with the average rent near the East London station of Dagenham Heathway costing £796 a month, while prices close to the suburban West London station of Hatton Cross are just £324 per month.

Data from June reveals that London rent is almost double the national average and rose by 10.7% over the year.

London has been ranked the third most expensive place to live, after the Cayman Islands and Switzerland.


How Have London Rents Risen?

Published On: August 20, 2015 at 4:47 pm

Author:

Categories: Landlord News

Tags: ,,,

Renters in London are paying some of the highest prices in the world and the rental market doesn’t seem to be getting any better.

Can looking at rent rises in the past indicate what’s in store for tenants in the future?

Studios

The median rent for a studio has increased by 15% in the last five years. In Hackney, the rise has been close to 40%, to £1,000 per month. However, this is still £300 cheaper than studio rents in the City of Westminster and the City of London, the most unaffordable boroughs.

How Have London Rents Risen?

How Have London Rents Risen?

In 2010/11, the median price was £736.67, which rose to £850 in 2014/15. In the cheapest 25%, prices have grown from £615 to £719 and from £975 to £1,083 in the top 25%.

One-bedrooms

Prices for a one-bedroom flat have increased by 22%, but by 30% in the outer boroughs of Ealing and Greenwich. Alongside rents in Westminster, Kensington and Chelsea and the City of London, median prices in Camden have exceeded £1,500 in the last five years.

The median price was £950 five years ago, but is now £1,155. In the bottom 25%, prices have gone from £760 to £922, and in the most expensive 25%, from £1,278.33 to £1,430.

Two-bedrooms 

A median-priced two-bed home in 2010/11 would cost £1,200 per month, but now this will only get you a property in the bottom 25%. Greenwich and Waltham Forest experienced the greatest increases of 39% and 32% respectively.

The median price has risen from £1,191.67 to £1,400 in the last five years and prices in the bottom 25% have gone from £950 to £1,200. In the top 25%, rents rose from £1,550 to £1,733 a month.

Three-bedrooms

The median rent for a three-bed home in 2010/11 won’t even pay for a three-bed flat in the bottom 25% today. Richmond upon Thames saw an increase of 39% over this period. Rents in Hackney and Lambeth have grown to over £2,000.

The median rent has risen from £1,350 to £1,695 in the past five years for this property type. The lowest 25% of rents are up from £1,150 to £1,400 and the most expensive rents grew from £1,841.67 to £2,250 per month.

Four or more bedrooms

Rents on a four-bed home have increased by an average of 25% over the last five years. In Hammersmith and Fulham, they’ve risen by over 50%, from £2,815 to £4,312. However, this is still significantly less than the median price of a four-bed property in Kensington and Chelsea, which is £9,425 a month.

The median price on this kind of home has grown from £2,000 to £2,500 since 2010. In the bottom 25%, rents have increased from £1,500 to £1,900 and from £2,730 to £3,445 in the top 25%.

London’s Renters Move to Suburbs

The soaring cost of renting in London is pushing private renters away from the centre of the capital. The London boroughs of Kingston, Bexley and Harrow are now experiencing the highest demand from prospective tenants.

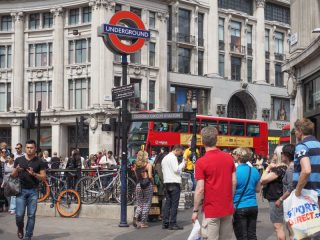
Kingston upon Thames, South West London, attracts the highest amount of online rental property searches every day, with each advertised home being viewed online ten times per day.

This compares to just 4.6 views for properties in the City of London, which has the lowest rental demand, according to online property firm Rentify. The company has analysed data from all major property portals over the three months to the start of July.

Areas with the highest rental demand in London

Borough

Online views per property per day

Kingston 10
Bexley 9.9
Harrow 9.7
Sutton 9.5
Enfield 9.4
Bromley 8.9
Hillingdon 8.8
Croydon 8.7
Richmond 8.6

Greater London covers an area of around 600 square miles and has over eight million residents. It is one of the most crowded property markets of the UK. As the city is facing a serious housing shortage, affordable properties are harder to find in central London. This is pushing many people into the outer districts.

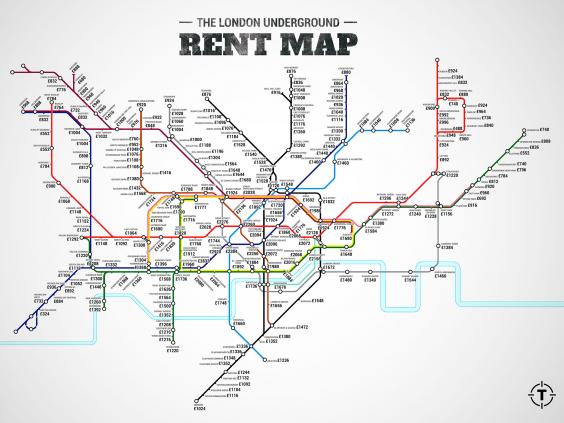
The average rent cost in Kingston is £1,326.49 per month, compared with £2,334.70 a month in the City of London, which is the most expensive area to rent in London.

Rents across the whole of London average £1,500 a month, however this varies hugely depending on the borough.

The second most popular area for rental searches is Bexley, South East London. Here, each property receives 9.9 online views a day. The borough has good transport links to inner London, but still has a suburban atmosphere, with over 100 parks and open spaces. It also has some of the most affordable rents in Greater London, with an average price of £1,026.20 per month.

Demand from students is high, due to the nearby University of Greenwich, amongst other colleges.

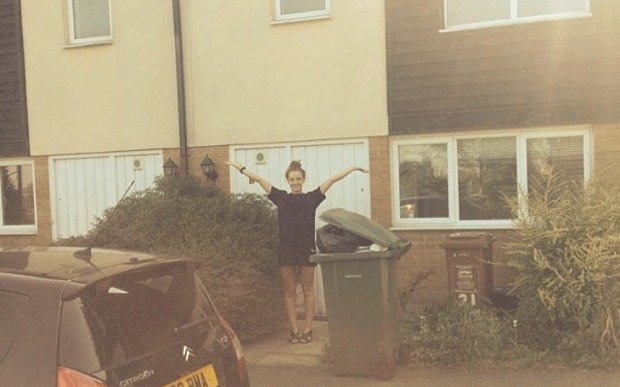
Amber Thompson is a 23-year-old dancer from Nottingham. She paid £390 a month to rent an ensuite room in a four-bedroom house between August 2013 and January 2015. In the past six months, she has been paying £650 per month for a tiny room on Tooley Street, near London Bridge. She is planning to move back to Bexley.

She notes: “Rent costs in Bexley aren’t anywhere near other areas in central London. You can find a decent-sized four-bedroom house here for £1,500 a month. However, it’s really competitive; the whole process took five or six weeks last time.

“Most viewings will have at least seven groups of prospective tenants looking round at once.”1 

The second most expensive area to rent in London is the City of Westminster, with an average price of £2,181 per month.

Unsurprisingly, demand is lower in this area, with properties attracting just five views a day.

Tom Dymond, a 26-year-old freelance photographer moved to Oxford Street around three years ago. He pays £1,600 per month for a one-bedroom flat, which took just two weeks to organise.

Borough

Average rent per month

Sutton £1,016.83
Bexley £1,026.20
Croydon £1,084.79
Kingston £1,326.49
Richmond £1,364.30
Hackney £1,451.79
Wandsworth £1,682.68
Kensington and Chelsea £1,875.22
City of Westminster £2,181
City of London £2,334.70

He says: “I didn’t find the process particularly competitive. The rents around here aren’t the cheapest and the flat had been on the market for a while. I used to live in Shepherd’s Bush and that was far more competitive. You could get 20 people turn up for a viewing.”1

Average rents around London

Kensington and Chelsea accounts for just 1% of the capital’s total area, but is another of the most expensive boroughs in London, with an average rent of £1,875 per month. Residents enjoy a thriving nightlife, including celebrity hotspot clubs.

However, the high cost of renting here is putting off aspiring tenants. Advertised properties attract just 5.3 online views per day.

Harrow, North West London, is an up-and-coming area. It is known for its independent school, but is also home to a range of semi-detached houses and flats with good transport links to central London.

The average rent here is £1,269.27 per month, a double-digit rise in the past year.

Chief Executive of Rentify, George Spencer, comments: “High rent prices in London are not a surprise anymore. But the figures show how tenants in certain areas of London are pretty desperate, sometimes visiting a property online up to 15 times a day.

“There is a severe housing shortage in the capital that becomes more evident in the peak rent season of late spring and early summer.”1

1 http://www.telegraph.co.uk/finance/property/11751951/Revealed-the-London-suburbs-sucking-in-cash-strapped-renters.html?utm_campaign=Landlords%20%26%20Property&utm_content=18064052&utm_medium=social&utm_source=twitter