The gap between house prices and wages has widened so much in the last 20 years that even in the most affordable parts of England and Wales, buyers must spend six times their income on purchasing a home, according to new analysis.
The situation is most serious in London, where the median house is now 12 times the median income in the capital.
The Guardian has analysed 19m home sales over 20 years from Land Registry and HM Revenue & Customs (HMRC) data. The research shows that in every region of England and Wales, there have been sharp rises in property prices in proportion to wages, causing concerns that millions of aspiring buyers will be priced out of the market.
Ratio of house prices to incomes in 2012-13
|
Region
|
Median income |
Median house price |
Ratio
|
| London |
£24,600 |
£300,000 |
12.2 |
| South East |
£23,100 |
£229,000 |
9.9 |
| South West |
£20,300 |
£187,500 |
9.2 |
| East of England |
£21,900 |
£192,995 |
8.8 |
| West Midlands |
£19,900 |
£145,000 |
7.3 |
| East Midlands |
£19,900 |
£137,748 |
6.9 |
| Wales |
£19,400 |
£132,000 |
6.8 |
| Yorkshire and the Humber |
£19,600 |
£130,000 |
6.6 |
| North West |
£19,700 |
£130,000 |
6.6 |
| North East |
£19,700 |
£120,000 |
6.1 |
A buyer earning the median salary for their region in 1995 would have spent between 3.2 and 4.4 times their earnings on a house, depending on where they lived. In 2012-13 – the latest year for which complete data is available – the median house price had increased to between 6.1 and 12.2 times median regional wages.
In 1995, the median salary in London was £19,000 and the median house price was £83,000, meaning that people spent 4.4 times their income on buying a home. However, by 2012-13, the median income had grown to £24,600 in the capital and the median house price had risen to £300,000, causing people to spend 12.2 times their wages on a property.
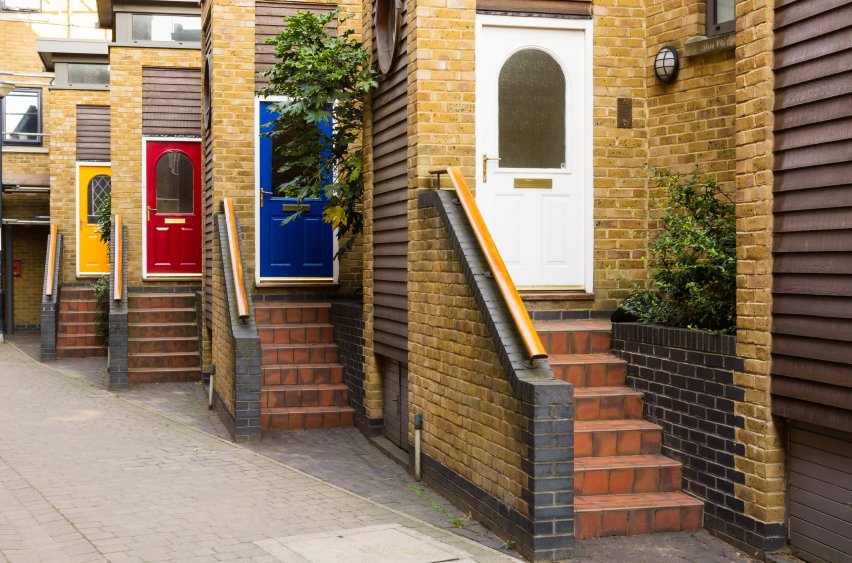
Even in more affordable regions, prices have grown substantially. In the most inexpensive region, the North East, the proportion of earnings spent on homes has almost doubled in 20 years, rising from 3.4 times the median income in 1995 to 6.1 times in 2012.

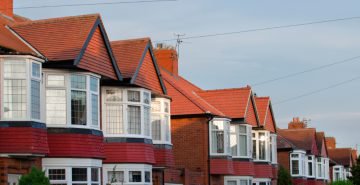
Gap Between House Prices and Wages Widens
Residential Research Director at Hamptons International estate agent, Fionnuala Earley, says: “House prices have completely outstripped income growth.
“The biggest factor is that in the run-up to the crash, interest rates were low, so you could afford to service a bigger mortgage then. There was also low inflation on essentials like food, fuel, transport and utilities, so people had more money in their pockets and were able to gear up for bigger mortgages.”1
The director of affordable housing campaign group PricedOut, Duncan Stott, says that the figures suggest the gap between the “housing haves and the housing have-nots” is getting even wider.
He explains: “It’s not just that every region has got more expensive, but how much more expensive some regions have got. When you look at places where housing prices are increasing, places like Cambridge, Reading, Bristol, Oxford… These are places where jobs are being created but they’re completely unaffordable, so there’s a huge mismatch between the labour market and the housing market.”
Behind London, the most expensive regions for homes are the South East and South West, where properties cost 9.9 and 9.2 times the median salaries of those regions respectively.
After the south, the East of England follows with 8.8 times the median income, the West Midlands is next at 7.3 times, then the East Midlands at 6.9, Wales at 6.8 and Yorkshire and the Humber and the North West, both at 6.6 times median wages.
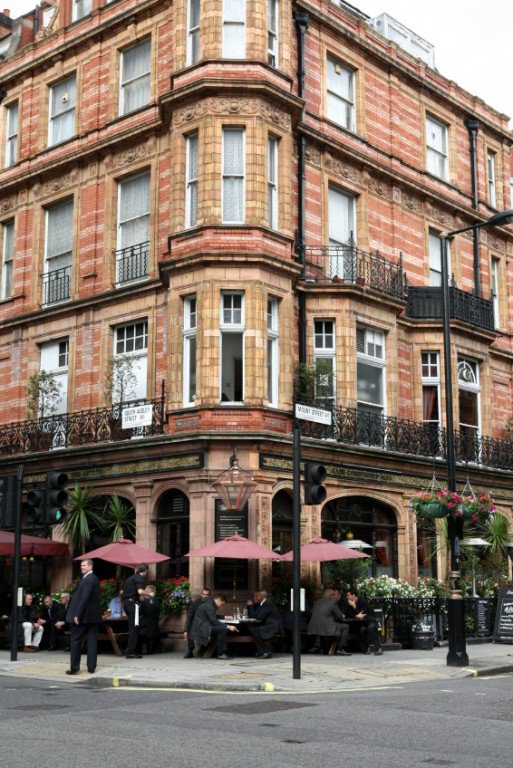
The most expensive postcode district to buy a home in 2014 was Mayfair, London. 26 properties were sold there last year, with a median price of £2.9m. The most expensive home sold in that area cost £18.4m and the cheapest was £155,100.
The 36 most expensive postcode districts in the country were in the capital, with Leatherhead in Surrey coming 37th. In Leatherhead, the median house price in 2014 was £775,000 and the most expensive property sold that year for £2.9m.
The cheapest postcode district was central Bradford in West Yorkshire, where there were 191 property sales in 2014. The median house price in BD1 was £40,000 and the cheapest sale was £29,000.
Behind Bradford, the most affordable districts were Ferndale in the Rhondda Valley, followed by Grimsby in Lincolnshire, New Tredegar in Caerphilly and Middlesbrough
The most expensive home sold to an individual in 2014 was in London and cost £50m, while the cheapest was £7,000 in the North East.
The gap between house prices and earnings has caused the Organisation for Economic Co-operation and Development (OECD) to put the UK in the category of countries “where houses appear overvalued but prices are rising.” 1
The OECD warns that economies in this category, including Canada, Australia and New Zealand, are prone to the risk of price corrections.
Stott cautions that increasing house prices mean more people will be permanent renters, which could have various effects on society.
He says: “It takes a toll on young people who can’t afford a house. A lot of us are going to be spending our lives renting and we need to be thinking about the implications for children growing up in private rentals and how on earth we pay the rent when we retire, which no one is talking about.
“It’s an unsustainable setup we’ve got, if we don’t deal with problems now – the lack of supply, lack of mortgage controls and lack of property tax reform – we’re going to sleepwalk into these problems.”1
1 http://www.theguardian.com/uk-news/2015/sep/02/housing-market-gulf-salaries-house-prices