Posts with tag: prime central London property market

Prime Central London Property Market Continuing to Drop

Prime Central London Property Market Continuing to Drop

Prime Central London Property Market Continuing to Drop

The prime central London property market is continuing to drop, according to the latest report from Knight Frank estate agents.

It found that the amount of applicants decreased by 30% in September, compared to the same month in 2014. House prices also fell, by 0.3%.

The number of properties exchanged in the three months to the end of September was around 17% less than in the same period last year.

A partner at Knight Frank, Noel Flint, believes that currency fluctuations and Stamp Duty changes are deterring foreign buyers from the London market.

He says: “There are far fewer Russian buyers in London looking to spend £5m to £10m. Their budgets have been trimmed, as the rouble is a fraction of what it was. Ditto the Far Eastern buyers.

“Now the pound is so strong, London is not seen as such good value for money.”1

As a result, Knight Frank has reduced its annual house price growth forecast for 2016 from 4.5% to 2%.

Even if you do not own a property in the prime central London market, it is important to be aware that trends in this sector can spread to other parts of the capital, and sometimes across the country, particularly the South East.

Ensure you keep up to date with the property market in your area, and understand how it could be affected by what’s going on in London.

1 http://www.propertyindustryeye.com/going-down-prime-central-london-market-continuing-to-dip/


East-West Divide Growing in Central London Property Market

Property sales in the prime central London market increased in the month to September, but the general slow mood of the year is continuing, as higher Stamp Duty costs are causing buyers to become more reserved.

These are the messages arriving from Knight Frank’s latest sales index for the capital.

For the whole region, annual price growth dropped to 1.3%, the lowest rate since October 2009. However, prices fell by over 3% in some areas to the west of central London.

East-West Divide Growing in Central London Property Market

East-West Divide Growing in Central London Property Market

The data also reveals that new prospective buyers decreased by 34%, but viewings dropped by just 4%.

An east-west divide appears to have manifested around Hyde Park, with prices rising to the east, in Islington, the City of London, Marylebone and Mayfair, but falling in the west, in Notting Hill, South Kensington and Knightsbridge.

The report states that the divide is possibly due to a greater proportion of larger homes in the west, which are now affected by higher Stamp Duty.

Head of London Residential Research at Knight Frank, Tom Bill, comments: “Underlying demand remains strong but buyers have become more circumspect and stringent in their requirements due to the Stamp Duty increase.

“This heightened price sensitivity among buyers has resulted in a flight to quality, meaning demand is particularly strong for properties in the best condition and on a prime floor, street or square.

“So, while the anticipated gear change materialised as summer moved into autumn, there was no sense the market is entering full-blown recovery mode after what has been a subdued 2015.”1

Director of W.A. Ellis, Richard Barber, adds: “Transaction levels have been down throughout the spring and summer months and, whilst some of this reduction may have been due to election jitters, it is now apparent that the increase in Stamp Duty is the main driver behind this trend.

“Whilst the Government may not wish to admit that HMRC’s Stamp Duty revenue has diminished by £1.5 billion in the first six months of 2015, compared with the previous six months, it is unlikely that George Osborne will reduce the new levy at this stage in the political cycle.

“With lower transaction levels across prime central London, it is clear that quality is a priority for buyers, notably, the most recent transaction within our prime central London postcodes have all been properties of the highest quality with exceptional attributes.”1 

In the lettings sector, Knight Frank reports that annual rental growth fell to 2.4% in September, the lowest figure since September 2014.

This decline is thought to be the result of contagion from the Chinese economic crash, with firms more hesitant to recruit or spend on relocation for senior executives.

This has caused the number of agreed tenancies in the three months to August to fall by 5.9% over the year and the amount of viewings to decrease by 10.2%.

Knight Frank expects this trend to continue in the short term.

However, the report found that the trend is less clear in the lower and higher price ranges, with demand among young professionals remaining strong, but demand in the super prime market of £5,000 per week and over has “been buoyed by the fact tenants have moved across from the sales market due to the Stamp Duty increase”1. 

1 http://www.propertyindustryeye.com/stamp-duty-changes-create-eastwest-divide-in-prime-central-london/


Prime Central London House Price Growth Lowest for Five Years

There were 26% fewer homes sold for £1m or more in the prime central London market in the last 12 months.

The Land Registry data is supported by Knight Frank’s most recent prime central London sales index, which reveals that annual price growth, at 1.7%, was at its lowest level for over five years.

Without including the newest prime central London markets of Islington, Riverside, City & Fringe and Southbank, growth was at just 0.4% in the past year.

Prime Central London House Price Growth Lowest for Five Years

Prime Central London House Price Growth Lowest for Five Years

The Knight Frank report on prime central London sales in August states: “Demand was unsurprisingly restrained in August. It is typically one of the quieter months of the year, however, this seasonal trend was compounded by the fact that buyers have been coming to terms with higher Stamp Duty (for properties worth more than £1.1m) and uncertainty in global financial markets.”

The report also says that the market in August was particularly affected by China devaluing its currency, which has caused “some buyers to postpone decision-making until there is a greater sense of certainty.”

However, it adds: “On the other hand, there is evidence Chinese buyers have stepped up their interest in safe haven global property markets like London and are increasingly looking for homes in golden postcode neighbourhoods like Mayfair.”

The annual price growth of 1.7% is the lowest increase since November 2009, eight months after the market bounced back from its post-Lehman Brothers low.

But the report is optimistic: “The seasonal nature of the market dictates buyers will become more active in the autumn and a greater sense of normality will return to the market, which will also be driven by the fact vendors are lining up new properties for sale.”1

Tom Middleditch, an associate director at JLL Kensington, comments: “Pre-election weakness affected both the sales and lettings market, but this was reversed with the Conservative Party win.

“Although transactions were not quite at the euphoric levels that some agents reported in the immediate election aftermath, prime markets are now rebuilding stock levels and should find moderate activity growth in Q3.

“However, the lack of sales stock continued to push occupiers into rental property. This was particularly notable for corporates who, alongside strong demand from students, pushed up new lettings by 93% in June compared with 2014.”1 

1 http://www.propertyindustryeye.com/prime-central-london-price-growth-lowest-for-five-years/

Just 2 Places Have Slower House Price Growth than Prime London

Just two areas have seen house price growth that is slower than the drastically falling prime central London market.

The biggest property price growth in the capital is now in more affordable areas.

Luxury London homes once kept the housing market stable, with values rising by 86% since hitting a low in 2009, revealed Hometrack.

The prime central London market grew by just 1.6% in the past since months, putting it in the bottom three of the house price index.

The only areas with slower growth were Dundee at 0.1% and Sunderland at 0.7%.

Prices have dropped in the last year in some of the most exclusive postcodes of London. They fell by 7% in Knightsbridge, 1% in Chelsea and 0.8% in Kensington.

Some areas that experienced stronger growth than prime central London were Middlesbrough, Rochdale and Grimsby.

Worst areas for house price growth

Area

House price growth in last year

Dundee 0.1%
Sunderland 0.7%
Prime central London 1.6%
Plymouth 1.7%
Telford 1.9%
Middlesbrough 2%
Blackpool 2.3%
Swansea 2.5%
Blackburn 2.6%
Rochdale 2.7%
Just 2 Places Have Slower House Price Growth than Prime London

Just 2 Places Have Slower House Price Growth than Prime London

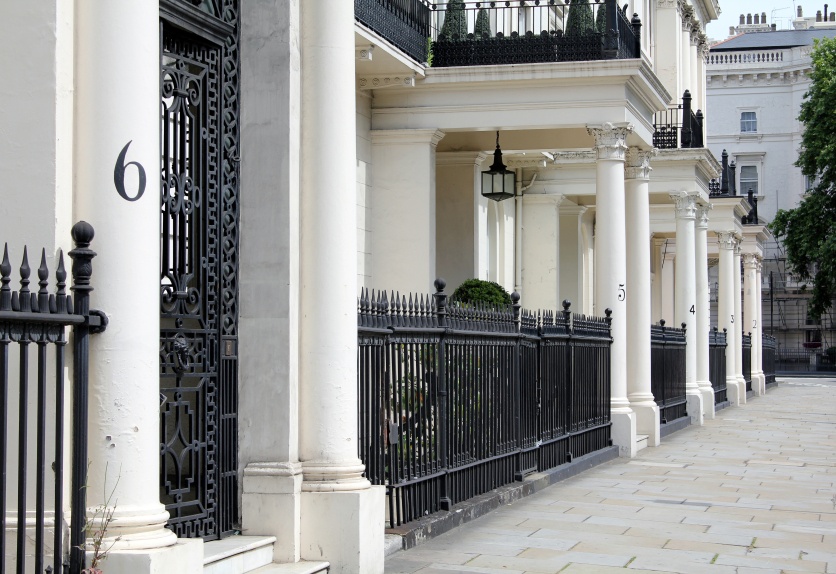
Hometrack has identified prime central London as the most expensive international market in the capital, containing just over 100,000 or 3% of London’s homes in areas such as Chelsea, Belgravia, Knightsbridge, Mayfair, Marylebone, Hampstead and Kensington.

However, average prices in these locations are still 55% higher than they were at the 2007 peak, now at a staggering £1,044,250.

Contrastingly, all other areas in the bottom ten have experienced house price decreases since the peak.

Richard Donnell, Hometrack’s Research and Insight Director, says that tax changes, such as Stamp Duty reform, have affected the most expensive properties and put buyers off.

He continues: “Last year, George Osborne introduced some tax changes – higher levels of Stamp Duty, overseas investors have to pay Capital Gains Tax [CGT]. There were concerns about the mansion tax and sterling started to appreciate.

“There’s still overseas demand, but rather than looking like a red-hot buy, people have started to question whether it can keep going up.”

Instead, Donnell observes that growth is “coming out of the cheapest parts of London.”

He specifies: “At the moment, it’s places like Newham, Barking and Dagenham and in the commuter areas, places like Watford. They are the ones that are keeping the momentum going in our London city index.”

The new data also indicates a continued north-south divide, with all of the fastest growing areas for house prices located in the south, especially near London.

Top ten areas of house price growth

Position

Area

House price growth in last year

1 Luton 13.1%
2 Oxford 12.3%
3 Milton Keynes 11.4%
4 Reading 11.3%
5 Crawley 11.2%
6 Bristol 10.9%
7 Brighton 10.1%
8 London 10.1%
9 Southend-on-Sea 10%
10 Medway 9.9%

Donnell advises buyers to search for markets with growing levels of employment and earnings, “markets just outside the great M25 area, where there’s value for money in housing.”

He adds: “It’s going to continue to be your Aldershots, your Crawleys, the Medway towns – affordable and accessible markets around London will continue to increase.”1

Big cities such as Manchester, Birmingham and Leeds are experiencing increases in new jobs, which will also push up prices, says Donnell.

1 http://www.telegraph.co.uk/finance/property/house-prices/11790634/Just-two-places-where-house-price-growth-was-slower-than-luxury-London.html

Prime Central London Sales Up but Down 32% Annually

House sales in the prime central London market rose by 21% in the second quarter (Q2) of 2015 compared to Q1, but are down 32% annually, according to the latest quarterly report.

Prices have fallen slightly, by 0.6% over Q2 compared with the previous quarter, found recent prime central London data from real estate firm JLL.

Prime Central London Sales Up but Down 32% Annually

Prime Central London Sales Up but Down 32% Annually

However, the report says that the sales market remains resilient and although cautious, buyer demand has recovered since the drop before the general election in May.

Stamp Duty reform is still impacting the market though, and buyers and vendors are assessing the effect of these changes, especially in the £5m-£10m price range.

Meanwhile, the sub-£2m market has been the least affected by the election, Stamp Duty and mansion tax threats, with prices up 2.2% annually.

Sales Director at W.A.Ellis estate agents, part of JLL, Richard Barber, says: “While transaction levels remain low, particularly in the £3m-£7m sector of the prime central London market, there is undoubtedly a noticeable flight to quality.

“Affordability issues, in the face of increased Stamp Duty costs, have affected purchaser confidence, but high prices per square foot are still being achieved for the most exclusive properties.”1

The prime central London lettings market has experienced an increase in demand from private renters and supply levels have remained high throughout Q2, claims the report.

It adds that London’s improved economic conditions are causing growth in rent prices, up 1% compared to Q1 and 1.5% on last year.

Lettings transactions have risen by 4% overall in Q2, as election uncertainty caused some buyers to rent instead. Year-on-year, transactions are down 8%.

Letting Director and Head of Agency at W.A.Ellis, Lucy Morton, explains: “There has been an increase in rental stock available, mainly as a result of landlords awaiting the outcome of the general election and deciding now to let instead of sell, and these higher stock levels have meant that competition between landlords has increased, with properties in optimal condition letting first.

“This has also meant that the market has become very price sensitive with more people turning to the rental sector after being unable to secure finance or find the right property to buy.”1

The report concludes that the future of the prime central sales market is looking stable due to the majority Government and low interest rates. Prices are expected to rise by 1.5% during the rest of the year.

The lettings market is due to see rental values increase by around 3%, with more people preferring the flexibility of renting.

1 http://www.propertywire.com/news/europe/central-london-prime-property-2015080310817.html