Posts with tag: first time buyers

Mortgage Lending Up on Monthly and Quarterly Basis

Published On: August 16, 2017 at 9:26 am

Author:

Categories: Finance News

Tags: ,,,,

The latest UK Finance data, for June 2017, shows that mortgage lending was up on both a monthly and quarterly basis.

Monthly figures

On a non-seasonally adjusted basis, UK Finance found that mortgage lending rose in June.

First time buyers borrowed £5.9 billion – up by 26% on May and 9% on an annual basis. This equated to 36,000 loans – up by 22% month-on-month and 6% on June last year.

Home movers borrowed £7.8 billion, which was up by 26% on the previous month and 15% on June 2016. This totalled 36,500 loans – up by 24% on a monthly basis and 9% compared to a year ago.

Homeowner remortgage activity totalled £6 billion in June – a rise of 5% on May and 7% annually. The number of remortgage loans reached 34,300, which was up by 5% on a monthly basis and 6% on June last year.

Gross buy-to-let lending totalled £3 billion – up by 3% month-on-month and 3% on June 2016. This equated to 19,700 loans – up by 3% on May and 6% on the previous year.

On a seasonally adjusted basis, lending to first time buyers and home movers remained relatively unchanged month-on-month, but there were increases by volume and value on an annual basis. Buy-to-let and remortgage activity remained relatively unchanged in June from May.

The proportion of household income used to service capital and interest rates continued to sit near historic lows in June, for both first time buyers and home movers, at 17.3% and 17.5% respectively.

Mortgage Lending Up on Monthly and Quarterly Basis

Mortgage Lending Up on Monthly and Quarterly Basis

Affordability metrics for first time buyers saw the average loan size increase from £137,000 in May to £139,000 in June. The average household income rose from £40,500 to £41,000 over the month, meaning the income multiple went up from 3.58 to 3.59.

The average amount borrowed by home movers in the UK grew to £180,000 from £177,000 in June, while the average home mover household income increased from £54,900 to £55,200, taking the income multiple to 3,39, from 3.37.

Buy-to-let activity was driven by remortgaging lending in June, which accounted for over two thirds of total lending. Buy-to-let house purchase and remortgage activity remained consistent with monthly levels seen since the change in Stamp Duty on additional homes, which was introduced in April 2016.

The Head of Mortgages at UK Finance, Paul Smee, comments: “June’s figures show a busy month in the mortgage market, with home movers having their highest monthly activity levels for over a year, and an especially high number of loans for first time buyers. Buy-to-let activity remains subdued compared to its 2015 peak, but consistent month-to-month since Stamp Duty changes in April 2016.

“But there are also signs of a softening market, and we are not anticipating that this performance will be sustained in the second half of 2017. A slightly lop-sided market could well show some growth in house purchase lending but alongside reduced remortgage and buy-to-let activity.”

Quarterly data

In the second quarter (Q2) of the year, homebuyers borrowed £34.4 billion – up by 18% on Q1 and 24% on Q2 2016. They took out 183,300 loans, which marks an increase of 16% on the previous quarter and 9% on last year.

Within this, first time buyers borrowed £14.8 billion – up by 18% quarter-on-quarter and 10% on Q2 last year. This equated to 91,400 loans, which was up by 15% on Q1 and 6% annually.

Lending to home movers totalled £19.6 billion, which is up by 19% on the previous quarter and 21% year-on-year. They took out 92,200 loans – up by 17% on Q1 and 13% on Q2 2016.

Homeowner remortgage activity totalled £16.9 billion – down by 11% on Q1, but up by 1% on a year ago. The number of remortgage loans stood at 96,600, which is down by 12% on a quarterly basis and 1% on last year.

Gross buy-to-let lending hit £8.4 billion, which was down by 6% on Q1 but up by 5% annually. This equated to 55,400 loans – down by 6% on the previous quarter, but up by 5% on Q2 2016.ICA-JL-VOTE-FOR-US


Foreign Investment is Pushing London House Prices Out of Reach of First Time Buyers

Published On: July 27, 2017 at 9:30 am

Author:

Categories: Property News

Tags: ,,,

Foreign investment into new build second homes and buy-to-lets in London could be pushing house prices way out of reach for the capital’s first time buyers, found the latest research by eMoov.co.uk.

Using recent data from the Land Registry, the online estate agent looked at the gap between the average first time buyer house price in the capital and the average price of a London new build since 2012. The analysis found that, not only has there been a consistently increasing deficit of 11-13% between 2012 and 2016, so far this year, that gap has already escalated to over 18%.

Despite recent hikes in Stamp Duty for second and buy-to-let homes, and Britain’s decision to leave the EU, a report by York University on behalf of the London Mayor, Sadiq Khan, has found that foreign investors are snapping up thousands of new build homes, which are suitable for first time buyers.

Foreign Investment is Pushing London House Prices Out of Reach of First Time Buyers

Foreign Investment is Pushing London House Prices Out of Reach of First Time Buyers

The boroughs with the highest percentage of foreign buyers were Westminster, Tower Hamlets and Greenwich, with between 9-11% of all London homes sold overseas.

Kensington and Chelsea (8.4%), Southwark (8.4%), Hackney (7.4%), Lewisham (6.2%), Hammersmith & Fulham (4.2%) and Newham (3.7%) also ranked in the top ten.

Over 50% of all London properties sold abroad were also below the £500,000 mark.

In 2012, the average first time buyer in the capital paid £264,682 for their property, however, the price of the average London new build was already over £30,000 more than this threshold, at £297,587 – a difference of 11.06%.

As London’s market continued to over-inflate, this gap grew marginally but consistently larger, stretching to 11.89% in 2013, 12.34% in 2014, 12.59% in 2015 and 12.98% in 2016. However, the recent influx of foreign investment may well have widened the gap beyond reach as, so far in 2017, the difference between the affordability of a London first time buyer and the capital’s new build homes is now 18.21%.

Largest current deficit 

Newham is by far the worst offender in terms of the gap between the borough’s average first time buyer house price and the cost of a new build. Since 2012, the gap has exceeded 22% (22.5%), again growing steadily from 22.76% in 2013, 22.72% in 2014, 22.81% in 2015 and 23.26% in 2016, before accelerating to 27.91% in 2017 alone.

Westminster is home to the second largest gap, currently at 16.87%, having sat between 10.79% and 12.43% since 2012.

Greenwich has the third greatest deficit, at 16.18%, having yo-yoed between 10.77% and 11.82% since 2012.

Southwark (15.37%), Wandsworth (14.72%), Lewisham (13.60%) and Hackney (12.11%) also have a current gap of over 10%. Hammersmith & Fulham (7.39%), Tower Hamlets (7.33%), and Kensington and Chelsea (1.82%) are home to the smallest differences.

Biggest changes

Although currently home to some of the smallest differences in price, prime central London has seen the greatest turnaround in the first time buyer to new build price gap over the past five years.

The high cost of property in Kensington and Chelsea means that the average first time buyer house price in the borough has actually been higher than that of a new build – over 6% higher in 2012. However, this gap has slowly closed and finally reversed in 2017, with new build prices now exceeding first time buyer costs by 1.82% – the biggest turnaround of all boroughs.

In 2012, the average first time buyer house price in Hammersmith & Fulham was also marginally higher than a typical new build (0.33%), but has since been outstripped by a consistent increase in new build house prices – the second largest turnaround in the capital.

Lewisham has also seen one of the greatest changes in the last five years, with a 129% change and fourth largest in the last year, at 66%.

Tower Hamlets ranks third behind the prime central London boroughs, with the gap widening by 134% since 2016 alone.

The Founder and CEO of eMoov, Russell Quirk, says: “Worrying signs for London’s first time buyers and signs that aren’t just restricted to London’s high-end market, with Tower Hamlet’s seeing some heavy levels of overseas investment as one of the capital’s more affordable boroughs.

“It’s clear that new build affordability has been an issue for first time buyers over the last five years, but this gap seems to have exploded over 2017 alone. Yes, foreign investment brings with it many benefits, including a trickle-down effect of funding for other housing initiatives at lower levels and, in fact, the nationality of a buyer is not the issue.”

He explains: “The issue is a buyer utilising a property as a second home or a buy-to-let in an already cutthroat rental market, while aspirational buyers remain in the doldrums of said rental market, prohibited from making that first step onto the ladder as a result.”

With these findings, it is no surprise that one in four young Londoners plan to move out of the capital to buy their first homes: /young-londoners-plan-move-capital/

ICA-JL-VOTE-FOR-US

Gross Mortgage Lending Hits £22.1bn in June, Estimates UK Finance

Published On: July 20, 2017 at 9:13 am

Author:

Categories: Finance News

Tags: ,,,

Gross Mortgage Lending Hits £22.1bn in June, Estimates UK Finance

Gross Mortgage Lending Hits £22.1bn in June, Estimates UK Finance

Gross mortgage lending hit £22.1 billion in June, according to the latest estimate from UK Finance.

This figure is 9% higher than May’s lending total of £20.3 billion and up by 3% on the £21.5 billion lent in June 2016.

Gross mortgage lending for the second quarter (Q2) of 2017 was therefore an estimated £60.3 billion. This is a 3% increase on Q1 and up by 6% on the £57.1 billion lent in Q2 2016.

Mohammad Jamei, the Senior Economist at UK Finance, comments on market conditions: “A period of belt-tightening now seems to be underway, as inflation begins to erode consumer spending power and consumer confidence weakens. Given that the economy and housing market are closely linked, this has contributed to the activity plateau since the start of the year.

“Looking ahead, housing market activity is likely to reflect economic conditions; a deterioration would likely dampen first time buyer numbers and homeowners remortgaging – the factors that have supported lending recently.”

The Director of chartered surveyor e.surv, Richard Sexton, also responds to the latest figures: “It’s positive that lending to first time buyers has continued to increase throughout 2017. We’re seeing similar trends in our Mortgage Monitor data and believe this is largely due to record low mortgage rates on offer, as well as the increased support of Government and lender schemes helping to get more buyers onto the ladder.

“The rise in remortgaging and first time buyer activity is a great step in the right direction, however, it is clear there is not enough movement in the mid-market. This is causing a bottleneck of housing supply and, in turn, is pushing up prices to historical highs. Confidence in the market and more favourable economic conditions should bring more fluidity to the market. As more existing homeowners climb the property ladder, they will eventually free up affordable property for those looking to get onto the first rung.”

The latest Council of Mortgage Lenders (CML) data, released through UK Finance, shows that mortgage lending was up for all borrowers in May.

One in Four Young Londoners Plan to Move out of the Capital

Published On: July 19, 2017 at 8:11 am

Author:

Categories: Property News

Tags: ,,,

One in four young Londoners are planning to buy their first home outside of the capital, according to a new survey into the sentiment of the region’s young residents.

The cost of living was the main reason cited by 27% of respondents, who believe that it would be too expensive to purchase their first home in the capital.

A further 6% of 25-34-year-old Londoners said they would put down roots elsewhere to give themselves and their future families a better quality of life. Another 8% of the 2,007 young Londoners questioned plan to move out of the capital for “other reasons”.

Excluding the 42% of respondents who answered, “I haven’t thought about this yet”, the results were even stronger. A total of 74% said they will buy their first home outside of London for one of the above reasons.

One in Four Young Londoners Plan to Move out of the Capital

One in Four Young Londoners Plan to Move out of the Capital

However, one in ten young Londoners said their love for the city would keep them there, while 4% cited “other reasons” as the main factor for staying in the Big Smoke.

The Director of Online Mortgage Advisor, which commissioned the survey, David Bird, says: “The stats from this survey evidence the sentiment that we’ve recognised in our own customers over the past couple of years. The number of first time buyers coming to us with enquiries about mortgages on properties outside the capital is on the rise, and we expect to see this continue as more and more people consider themselves to be priced out of London.

“In light of these results, we’ve created a tool called Is The Grass Greener?, which compares every single UK city, as well as London boroughs, to help first time buyers discover where they can get the most for their money and a quality of life that suits them. We’ve analysed both Government data and national statistics on a number of factors, including house price, crime rate, schooling standards and even the price of a pint!”

Using the tool, prospective first time buyers can see that Liverpool beats Wandsworth – a London borough with a population that is predominantly in its 30s – on statistics such as house prices, average first time buyer house price and cost of living. Manchester also has an average house price that is £429,201 cheaper than Wandsworth’s and has a higher capital growth rate.

The London Borough of Lambeth, which has a similar age demographic to Wandsworth, loses out to other cities, including Bristol, which has a much better crime and safety rate, along with lower petrol prices. According to UKCrimeStats, Bristol has a crime rate of 7.28, while Lambeth’s score is 15.16. This is based on crimes per 1,000 resident individuals.

Mark Homer, the Co-Founder of property education firm Progressive Property, comments: “Many younger Londoners want to live outside the capital as house prices become more detached from incomes, meaning that monthly payments and the deposit required to obtain a mortgage makes living in the capital unaffordable. This, coupled with the fact that many areas around London are still playing catch up with property prices, which have not risen as much since the credit crunch in areas around London as they have within, making these areas more affordable.

“Train services are also becoming quicker, with the East Coast Main Line, Crossrail and HS2 reducing journey times to the city, making commuting a viable option even from locations which were previously discounted as commuter locations. As the population of London grows, this trend is likely to continue, meaning areas surrounding London are likely to experience higher than average house price growth.”

Rose Jinks, of Landlord News and Just Landlords, explains how the change is affecting the private rental sector: “It’s not only first time buyers that are leaving the capital; landlords too are looking to other parts of the UK for high tenant demand and better rental yields.

“This should mean that those moving from London to other thriving cities should find an abundance of suitable rental properties before they can get onto the housing ladder themselves. Investing in large cities outside of the capital can therefore provide a win-win situation for all involved in the property market.”

However, she urges: “As ever, we encourage all landlords that provide rental housing to consider their tenants when setting rent prices, keeping the property safe and complying with rules and regulations governing the private rental sector. This will drastically improve the lives of those unable to buy their own homes.”

Mortgage Lending Rose for All Borrowers in May, Finds CML

Published On: July 13, 2017 at 8:18 am

Author:

Categories: Finance News

Tags: ,,,

Mortgage lending rose for all borrowers, including first time buyers and buy-to-let landlords, in May, shows the latest UK Finance data from the Council of Mortgage Lenders (CML).

Non-seasonally adjusted figures

On a non-seasonally adjusted basis, homebuyers borrowed £10.8 billion in May – up by 10% on April and 16% on an annual basis. This equated to 58,400 loans – up by 12% on the previous month and 10% on May 2016.

Within this, first time buyers borrowed £4.7 billion, which was up by 12% both on a monthly and annual basis. They took out 29,200 loans – up by 13% month-on-month and by 8% on May last year.

Home movers borrowed £6.2 billion – up by 11% on April and 22% year-on-year. This equated to 29,200 loans, which was up by 11% on a monthly basis and 13% compared with the previous year.

Homeowner remortgage activity was up by 10% by value and 9% by volume on April’s figures. Compared to May 2016, remortgage lending rose by 12% by value and 7% by volume.

Mortgage Lending Rose for All Borrowers in May, Finds CML

Mortgage Lending Rose for All Borrowers in May, Finds CML

Gross buy-to-let lending totalled £2.9 billion in May – up by 16% on April and 12% on May last year. This equated to 19,100 loans – a 16% increase on the previous month and 15% on a year ago.

The Head of Mortgages at UK Finance, Paul Smee, comments: “The apparent strong growth in mortgage lending in May might flatter to deceive. The relative weakness in lending last May, following the Stamp Duty changes, makes comparisons misleading. The seasonally adjusted data shows a less buoyant lending picture, with home buying activity remaining relatively unchanged month-on-month and remortgage lending gradually decreasing each month since January.

“In the summer months, we expect home buying activity to continue, with an even split between first time buyers and home movers, but in greater numbers than in the winter months; we expect buy-to-let to remain subdued compared to its recent 2015 peak.”

Seasonally adjusted data

On a seasonally adjusted basis, lending to first time buyers and home movers declined by value and volume in May compared with April, but rose year-on-year.

Buy-to-let and remortgage activity remained relatively unchanged in May on a monthly basis.

The proportion of household income used to service capital and interest rates continued to sit near historic lows in May for both first time buyers and home movers, at 17.3% and 17.5% respectively.

Affordability metrics for first time buyers saw the average loan size increase from £136,000 in April to £137,000 in May. The typical household income dropped, however, from £40,700 to £40,500. This meant that the income multiple went up, from 2.57 to 3.59.

The average amount borrowed by home movers in the UK increased from £176,500 to £177,000 on a monthly basis, while the typical home mover household income fell from £55,200 to £54,900. The income multiple for the average home mover went up, from 3.35 to 3.38.

Last month, the CML released a report into why there is a 400,000 deficit in housing transactions in the UK compared to pre-financial crisis levels. The report found that a decline in home movers was the predominant cause for the dip and explored the reasons why this was the case. The full report can be accessed here: https://www.cml.org.uk/news/cml-research/

During May, buy-to-let activity was driven by remortgage lending, which accounted for over two thirds of total lending. The number of loans for buy-to-let property purchase advanced in May remained low compared to activity seen before the change on Stamp Duty introduced last April.

The Sales Director of OneSavings Bank, Adrian Moloney, responds to the latest figures: “It’s steady as she goes for total buy-to-let lending. Purchase demand has been affected by a raft of recent tax and regulatory changes, which came into play this year, discouraging some amateur landlords. However, remortgaging activity is buoyant and its popularity is unlikely to wane in the face of landlords’ growing tax burdens, while many can still capitalise on record low interest rates to reduce their outgoings.

“As the industry looks ahead to PRA II [Prudential Regulation Authority Phase 2], we may see somewhat of a surge in activity, as investors look to complete deals before further changes come into play for portfolio landlords.”

Ishaan Malhi, the Founder and CEO of online mortgage broker Trussle, also comments: “While the housing market has been fairly subdued in recent months, remortgaging activity has remained resilient, thanks to the continued availability of attractive deals, which are encouraging more people to switch.

“This market has a far greater capacity than its current operating levels, as there are two million people in the UK unnecessarily sitting on Standard Variable Rate mortgages; likely to be paying far more interest than they would on the best market rates. If we’re to see remortgaging numbers rise further, as they should, more homeowners need to proactively manage their loan and switch to a better deal when their initial term is coming to an end.”

And finally, the Director of mortgage broker Private Finance, Shaun Church, adds: “Although lending picked up in May, the market remains subdued. The lack of available housing continues to limit lending volumes and, while supply-side issues persist, we are unlikely to see a significant increase in lending. A sluggish remortgage market has also contributed to disappointing overall figures, with the CML reporting that, on a seasonally adjusted basis, lending for remortgage has fallen every month since January.

“There are some clear positives to be taken from these figures, however. Lending remains stable in spite of wider political and economic uncertainty, suggesting the market has robust foundations. Demand from buyers continues to be supported by low mortgage rates and a growing number of products.”

Public Sector Property Purchasing Power Plummets, Finds eMoov

Published On: July 5, 2017 at 8:12 am

Author:

Categories: Property News

Tags: ,,,

The latest research by leading online estate agent eMoov.co.uk highlights the detrimental impact the 1% annual pay cap has had on public sector employees where their property purchase power is concerned.

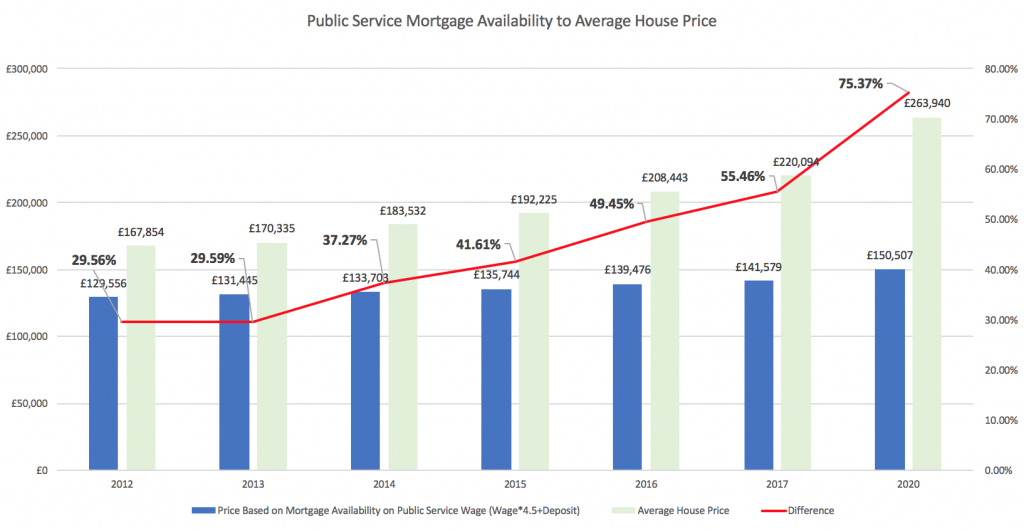
The agent analysed the annual average wage for the public sector since the 1% annual pay cap was implemented in 2012, and what that meant in terms of the price of property available with the mortgage approval rate at 4.5 times that wage (including a 10% deposit).

Public Sector Property Purchasing Power Plummets, Finds eMoov

Public Sector Property Purchasing Power Plummets, Finds eMoov

eMoov then compared this to the average house price at the time and the difference between the two, as well as how this gap has widened since.

Finally, with the 1% cap intended to stay in place until 2020, the agent also looked at how much further this gap could widen in the next three years.

Since 2012, the average UK house price has risen by more than £50,000 – up by 31.12%. However, at the same time, a 1% cap on public sector wages means that they have grown by just 6.03%. What this means is that as a typical salary multiple for a mortgage, the average public sector worker can afford a much inferior home than they could have afforded five years ago, due to being hit by both house price inflation and their static purchasing power where mortgages are concerned.

The gap between the cost of the average house price and the property purchase potential of the public sector salary has increased year-on-year.

In 2012, the average house price was £167,854, but the average public sector salary was £25,060. With a mortgage lender typically lending 4.5 times this wage and a 10% deposit of £16,785, a public sector employee could only afford to buy a property at a value of £129,556 – a difference of 29.56% between that and the average house price.

Since then, the gap has continued to widen, increasing to 29.59% in 2013, 37.27% in 2014, 41.61% in 2015 and 49.45% in 2016. So far, 2017 has recorded the largest gap, of 55.46%, with the average house price topping £220,094, while the average public sector wage has continued to stagnate, at £26,571. As a result, a public sector employee today can only secure a mortgage for a property valued at £141,579, including the 10% deposit of £22,009.

Based on the last three years of both house price and public sector wage growth, the forecast for 2020 – the proposed year for the 1% cap to run to – looks even bleaker.

By then, the average house price could be in the region of £263,940, with the public sector wage reaching an average of just £27,581. If this were the case, then public sector employees would only be bale to secure a mortgage on a property worth £150,507 with a 10% deposit of £26,394 – stretching the gap to a huge 75.37%.

The Founder and CEO of eMoov, Russell Quirk, comments on the findings: “The plight of today’s aspirational homeowner is a well-documented one, but it isn’t just a matter of age and the year you were born, the sector in which you choose to build a career can also have huge implications on your chances of getting on the ladder.

“It is very disappointing that those arguably the most deserving of a foot up on the ladder are the ones left well off the pace. If the cap were to remain in place until 2020, the difference between salary, the amount of mortgage available and the average house price will be cavernous for those in the public sector.”