This article is an external press release originally published on the Landlord News website, which has now been migrated to the Just Landlords blog.

With the start of the new Premier League season less than three weeks away, Raheem Sterling sitting atop a mountain of cash and dream team managers frantically honing their squads, an online estate agent has moved to assess the form in the Premiership property table.
eMoov.co.uk has looked at the average house prices in the twenty locations that make up the teams in the top flight. The results make for interesting reading, with a number of surprise results on the videprinter.
Champions League
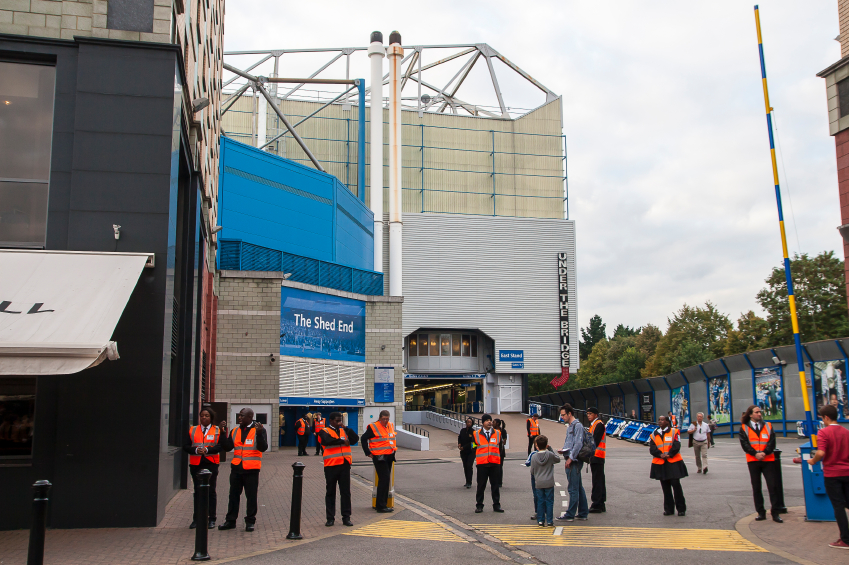
The traditional curtain raiser for the new season will once again be the Charity Shield, where Chelsea and Arsenal will kick-off proceedings. Unsurprisingly, these London giants have the two most expensive house prices in the Premier League figures.
Just as in the last campaign, Chelsea top the table, with average property prices in the SW6 postcode area at £1,137,550. However, a poor run of home form has seen these prices slip by 5% from the start of last season. On the other hand, property around the Emirates Stadium, home of Arsenal, has increased by 6%. Chelsea is unlikely to be feeling the pressure though, with a £600,000 cushion.[1]
Tottenham fans will be buoyed with the news that they are at least able to command third-position in one league, with property surrounding White Hart Lane climbing in value by 6% over the same period, to an average of £312,410. With a new ground on the horizon and with Seven Sisters tube station potentially part of the Cross Rail 2 development, Spurs could soon overtake their great rivals, at least in the property market.[1]
London clubs make up the entire top-six, with West Ham fans rubbing their eyes at the sight of themselves in 4th position. Average house prices here are £306,451, having risen by 7% since last year. A move to Olympic Stadium imminent, the Hammers could be particularly happy further up the league.[1]
Mid-table Manchester
Their ground may be known as the Theatre of Dreams but Manchester United languishes in mid-table in the property Premier League. However, rich neighbours Manchester City are close to the relegation zone in 16th position. What’s more, United has experienced marginally more property price growth since last season, with 4% in comparison to City’s 3%.[1]
Rivalry in the West Midlands sees West Brom once again finish higher than Aston Villa. Property prices around The Hawthorns stand at £131,398. In comparison, prices around Villa Park stand at £101,674, which sees the Villains in their familiar position just above the relegation zone…[1]
Property Premier League revealed
The newly-promoted clubs find themselves in positions that they could only dream of come the end of the next football season, with Watford in 5th, Bournemouth in 7th and Norwich in 11th position respectively. Championship winners Bournemouth in particular have plenty to be optimistic about, if the success of their neighbours Southampton is anything of a benchmark. Their south coast rivals have experienced a 5% increase in property prices over the last year, a total only outdone by a few London clubs.[1]
Scouse sorrow
There was however, bad news for both Merseyside giants, with Liverpool and Everton jointly propping up the table. Average property prices around both grounds were found to be £72,873, representing just a 1% increase.
The full table reads as follows:
| Rank | Team | Stadium | Postcode | Average House Price 2014/15 Season | % Change |
| 1 | Chelsea | Stamford Bridge | SW6 | £1,137,550 | -5% |
| 2 | Arsenal | Emirates | N7 | £575,676 | 6% |
| 3 | Spurs | White Hart Lane | N17 | £312,410 | 6% |
| 4 | West Ham | Upton Park | E13 | £306,451 | 7% |
| 5 | Watford | Vicarge Road | WD18 | £300,411 | 5% |
| 6 | Crystal Palace | Selhurst Park | SE25 | £295,165 | 4% |
| 7 | Bournemouth | Dean Court | BH7 | £270,511 | 3% |
| 8 | Southampton | St Mary’s Stadium | SO14 | £207,618 | 5% |
| 9 | Leicester | King Power Stadium | LE2 | £202,483 | 4% |
| 10 | Man Utd | Old Trafford | M16 | £194,297 | 4% |
| 11 | Norwich | Carrow Road | NR1 | £191,151 | 1% |
| 12 | Newcastle | St James Park | NE1 | £156,470 | 2% |
| 13 | West Brom | The Hawthorns | B71 | £131,398 | 2% |
| 14 | Stoke | Britannia Stadium | ST4 | £117,260 | 1% |
| 15 | Swansea | Liberty Stadium | SA1 | £115,584 | 0% |
| 16 | Man City | Etihad Stadium | M11 | £110,666 | 3% |
| 17 | Aston Villa | Villa Park | B6 | £101,674 | 4% |
| 18 | Sunderland | Stadium of Light | SR5 | £96,769 | 4% |
| 19 | Everton | Goodison Park | L4 | £72,873 | 1% |
| 20 | Liverpool | Anfield | L4 | £72,873 | 1% |
Russell Quirk, founder and CEO of e.Moov.co.uk, said, ‘although the top two make for familiar reading, it’s interesting that a successful, wealthy Premier League club doesn’t necessarily translate to a thriving property market in the surrounding areas. I think in terms of property, West Ham and Tottenham are the ones to watch.’[1]
‘The developments in terms of location and transport infrastructure should see prices in both areas boosted as a result,’ he added.’[1]
[1] http://www.propertyreporter.co.uk/property/how-does-your-team-do-in-the-property-premier-league.html