Home » Uncategorised »
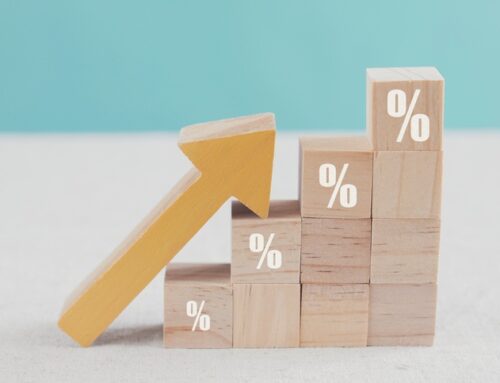
How has Christmas Present Inflation Compared to House Price Growth?
This article is an external press release originally published on the Landlord News website, which has now been migrated to the Just Landlords blog.

While we all know that house price growth has spiralled over the last few decades, how have Christmas present prices compared?
Online estate agent eMoov.co.uk has analysed the average house prices of the last 30-odd years against the cost of the must-have Christmas presents over each period.
1980: The Rubik’s Cube
In 1980, the average house price in the UK was just £23,497. Since then, it has increased by an alarming 778%. The most popular gift of the year was the Rubik’s Cube, which cost just £2 at the time. Today, however, the game sells for as much as £13 – that’s a 713% rise, which only marginally trails house price growth.
1990: Nintendo
In the early 90s, Nintendo burst onto the scene with its Gameboy, one of the first handheld videogame devices. At £71, they weren’t the cheapest Christmas present, but the latest DS 3D today comes in at over £100 more (£175), up by 146%.
Unsurprisingly, house prices have managed to beat this growth, up by 276% from the average value at the time, of £54,919.

How has Christmas Present Inflation Compared to House Price Growth?
1998: Furby
The Furby craze swept the nation back in 1998. The average house price of the time, £66,313, has now risen by 211%, but how has the Furby fared? Originally costing just under £25, the latest edition sells for £76 – a 206% increase.
2010: The iPad
As technology started to advance like never before, more traditional toys were put on the back shelf. In 2010, Apple flooded the market with its iPad – the perfect gift for someone needing something bigger than a phone, but not as big as a computer.
The original price of £400 has now gone up to a huge £729 – an 82% hike in just six years. Shockingly, this is well ahead of house prices, which have risen by just 27% over the same period.
2013: The Xbox
When the original Xbox was released in 2001, the average house price was £92,533, while the must-have games console cost £240. 12 years later, the price of playing an Xbox had increased by 67%, with the Xbox One costing £400. Over the same period, house prices rose by 89%.
Unfortunately for those that bought the Xbox One on release, the product hasn’t retained the upward price trend – in the last three years, the price of an Xbox One has fallen by half, now costing around £200. For homeowners, prices haven’t followed suit, and are up by a further 18%.
2016: Nerf
One of the hottest Christmas gifts this year is the latest Nerf gun. They first became popular in 2012, when the average house price was £162,924 and a Nerf would cost around £30.
In the last four years, house prices have continued to rise, up by 27%, while the Nerf gun has increased by 47% to over £40.
The Founder and CEO of eMoov, Russell Quirk, comments on the findings: “It’s a well-known fact that Christmas is probably the most expensive time of year, with many stretching beyond their means to provide the latest gifts and gadgets for their families.
“Therefore, it is hardly surprising that the cost of the must-have items during the holidays have seen similar, if not larger, price hikes than the UK property market itself.
“When people talk about the struggles of obtaining homeownership, they rarely consider the many underlying factors that come with it and the affordability issues of modern day life itself.”
He adds: “If you would have told me back in the 80s to invest into Rubik’s Cubes, I would have thought you were mad, but this research shows it probably wasn’t such a bad idea after all.”